|
Signup
today and save 50% on a Premium Membership Plan
which includes our new Market Timing Indicator and Stocks to Watch List
Weekend Stock Market Analysis
(7/10/04)
One of the key sectors to watch is the Semiconductors as the
Semiconductor Holders (SMH) so far have held support near their longer term
38.2% Retracement Level (calculated from the October 2002 low to the
January 2004 high) around the 34.25 area. Meanwhile another thing I'm
noticing is that the upward and downward sloping trend lines of the %K Line
(solid red lines) associated with the Slow Stochastics are narrowing which is a
signal that a substantial move in one direction or the other is increasing. If the SMH's fail to hold support near the 34.25 area then
look for an eventual drop back to their longer term 50% Retracement Level which
is around 31.50 (point A). 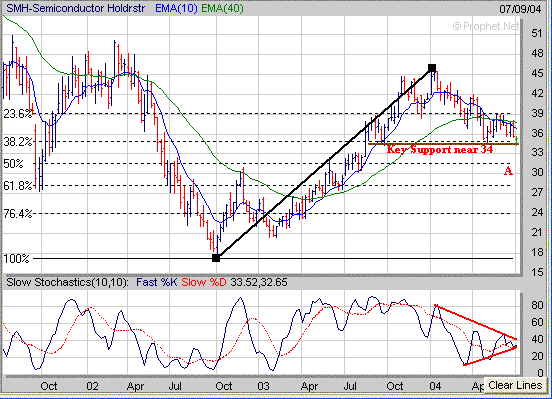
Meanwhile if the SMH's can hold
support near 34.25 and continue to rally then I would expect upside resistance
to occur at their 50 Day EMA (blue line) near 37. 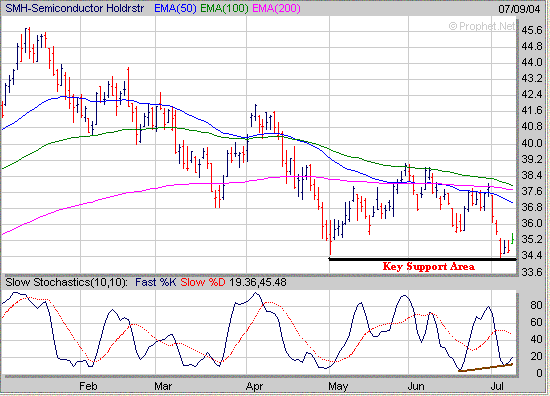
Another sector I'm watching is the
Brokers (XBD) which are testing a key support area near 120. If the XBD's
are unable to hold support near 120 then their next level of downside support
would be at their longer term 38.2% Retracement Level (calculated from the
October 2002 low to the February 2002 high) near 117 (point B). Meanwhile
a break below 117 would likely to a drop back to the XBD's 50% Retracement Level
near 107 (point C). Thus it is going to be important for the XBD's to not
drop below the 117 area in the days ahead. 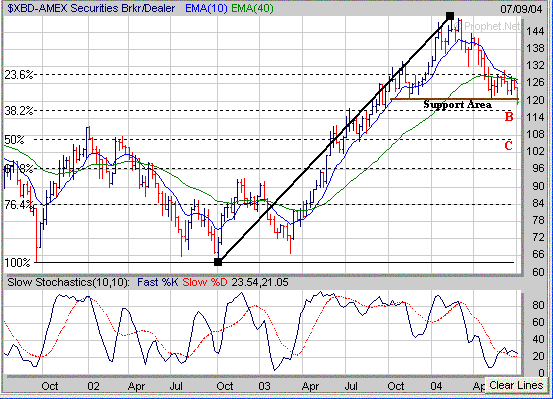
Meanwhile one discouraging sign is
the Oil Index (OIX) which is trying to move high after breaking out of a longer
term "Cup and Handle" pattern a few weeks ago. If the OIX
continues to follow through to the upside this could have a negative affect on
the market. 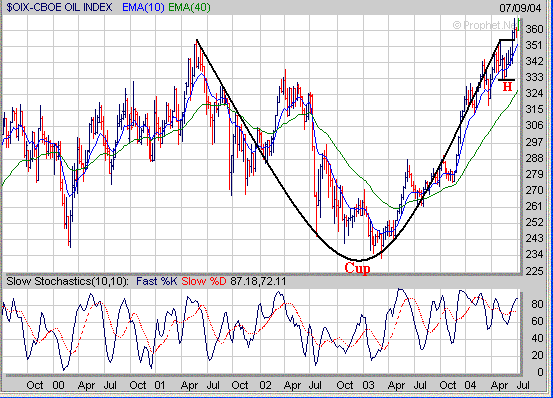
As far as the major averages the Dow
so far has held support above its 200 Day EMA (purple line). If we see
some type of oversold bounce continue next week I would look for upside
resistance in the 10275 to 10300 range which coincides with the Dow's 100 Day
EMA (green line) and 50 Day EMA (blue line). Meanwhile if the Dow reverses
to the downside instead and breaks below 10170 (point D) then look for it to
drop back to its 200 Day EMA near 10080. In the longer term if the Dow is
unable to hold support at its 200 Day EMA then I would expect a retest of its
May low near 9850 (point E). 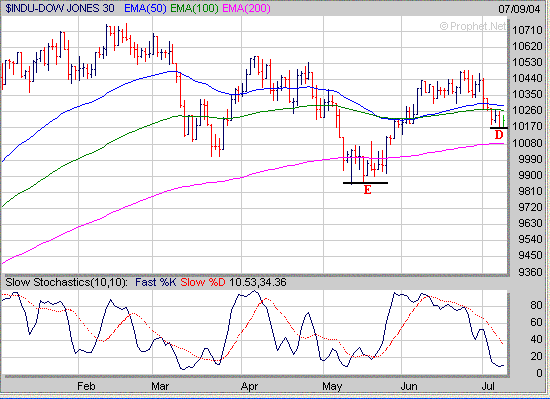
The Nasdaq has found short term
support at its 200 Day EMA (purple line) near 1935. If we see some follow
through to the upside next week I would look for upside resistance to develop
near 1980 which is where the Nasdaq's 100 Day EMA (green line) and 50 Day EMA
(blue line) are converging at. Meanwhile if the Nasdaq fails to hold support
near 1935 and continues lower then expect an eventual retest of the May low near
1870 (point F). 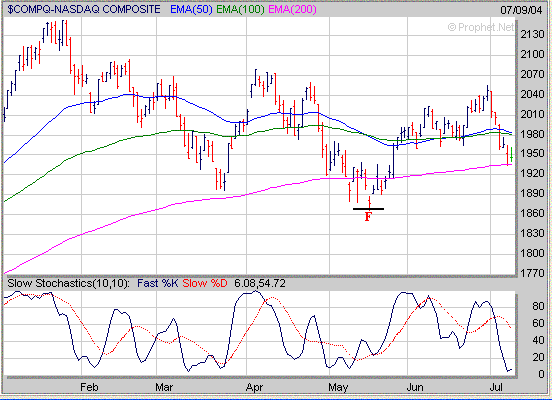
As far as the S&P 500 so far it
has held support above its 200 Day EMA (purple line). If the S&P 500
bounces from oversold conditions next week I would expect upside resistance to
develop at its 50 Day EMA (blue line) near 1123. Meanwhile if the S&P
500 continues its downward trend look for support at its 200 Day EMA near
1093. In the longer term if the S&P 500 fails to hold support at its
200 Day EMA then I would expect it to retest its May low near 1077 (point G). 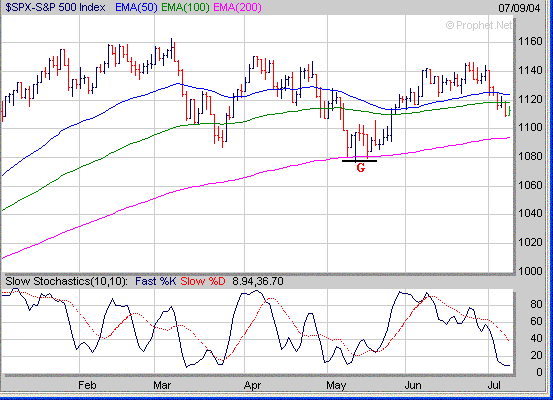
Meanwhile looking at the Volatility
Index (VXN) which tracks the Nasdaq 100 shows that it has gotten somewhat
overextended from its 10 Day Moving Average (MA) so it's possible it may briefly
revert back to its 10 Day MA which is currently approaching 21. If this
does occur then we may see some type of oversold rally occur next week for a few
days. A similar situation occurred in early May as the VXN pulled back to
its 10 Day MA (points H to I) and the Nasdaq rallied for a few days (points J to
K). However also notice that the VXN eventually turned higher again
(points I to L) as the Nasdaq trended lower (points K to M). 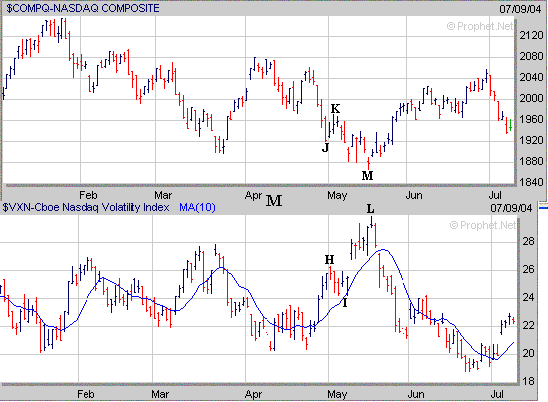
Finally I have developed a Market
Timing Indicator (MTI) which hopefully will help investors to determine when to
be in or out of the Market. For more information on the Market Timing
Indicator click on the link below. Amateur
Investors Market Timing Indicator (MTI) How can a Premium Membership to amateur-investor.net
benefit you as an investor? We focus on stocks which are exhibiting
favorable Sales and Earnings Growth that have developed a favorable chart pattern such as a
"Cup and Handle",
"Double Bottom", "Flat Base" or "Symmetrical
Triangle". These stocks are then
included in our "Stocks to Watch List" which gives investors a
quick reference to those stocks which may provide the best buying opportunities
to the long side in the weeks ahead. Each stock in
our "Stocks to Watch List"
includes specific Buy Prices, Stop Loss Prices (very important) and projected
Target Prices.
Signup
Today for a "Free" 2 Week Trial Membership
and see which Stocks to Buy or Short in the weeks ahead
Amateur-Investor.net
|


