|
Signup
today and save 50% on a Premium Membership Plan
which includes our new Market Timing Indicator and Stocks to Watch List
Weekend Stock Market Analysis
(7/17/04)
The Nasdaq continues to perform the worse of the three major
averages due mostly to the Semiconductors which have been getting destroyed
since peaking in early January. The Semiconductor Holders (SMH) failed to
hold support near their longer term 38.2% Retracement Level and now are
approaching their 50% Retracement Level around 31.50. On both a daily and
weekly basis the SMH's are becoming pretty oversold as the %K Line in
association with the Slow Stochastics has dropped below 20. The question
is now will the SMH's be able to hold support near 31.50 and try to bounce from
oversold conditions or will the selling pressure continue with a drop back to
their 61.8% Retracement Level near 28.50 (point A)? 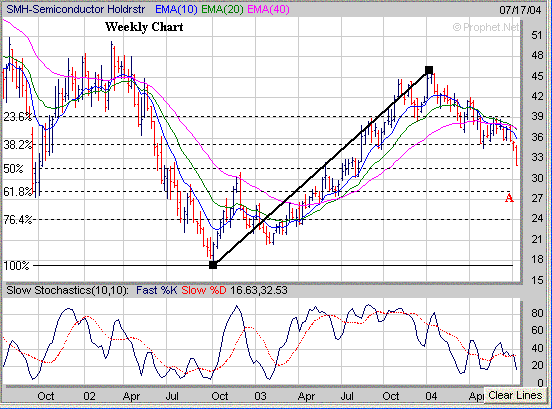 The Nasdaq on a weekly basis has a key support level near
1870 in my opinion. If the Nasdaq can hold support near 1870 then I would
expect an oversold bounce to occur. However if the Nasdaq breaks below
1870 then this could lead to an eventual drop back to its longer term 38.2%
Retracement Level near 1750 (point B). 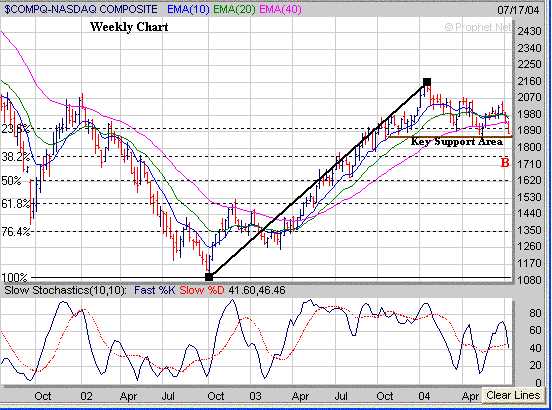
On a daily basis the Nasdaq is very oversold and as mentioned
above the key support level to watch next week is around 1870 (point C).
If the Nasdaq finds support at this level and then bounces from oversold
conditions I would look for the first area of upside resistance to occur around
the 1935 level which is at its 200 Day EMA (purple line). 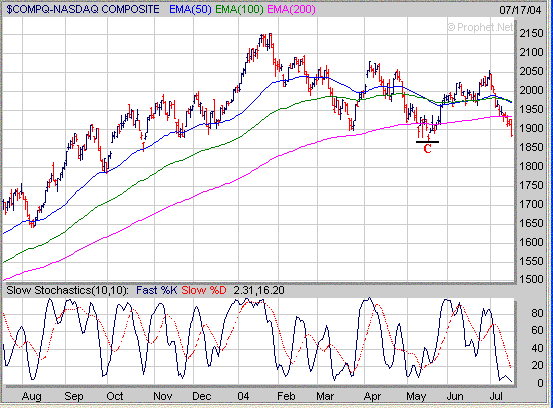
The Dow has been holding up much better than the Nasdaq as
money has been flowing out of the technology stocks into more defensive
issues. From a weekly perspective the Dow has a key support area in the
9850 to 9900 range which coincides with the recent May low and its longer term
23.6% Retracement Level. As long as the Dow can hold support at or above
9850 this will be a positive sign going forward. However if the Dow eventually
breaks below 9850 then that would likely lead to a downward move back to
its longer term 38.2% Retracement Level near 9400 (point D). 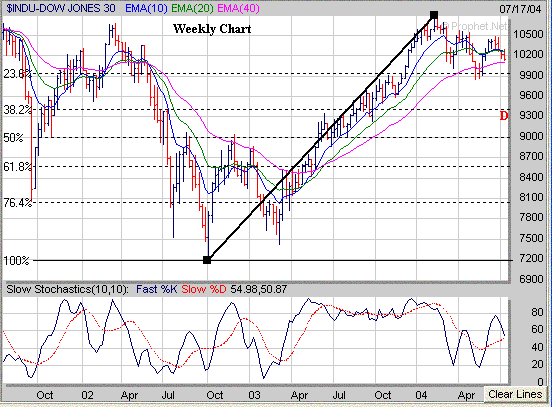
On a daily basis the key short term support level to watch is
at the Dow's 200 Day EMA (purple line) just below 10100. If the Dow can
hold support at this level next week and begins to bounce look for initial
resistance to occur around 10275 which coincides with its 50 Day EMA (blue line)
and 100 Day EMA (green line). Meanwhile if the Dow fails to hold support
near 10100 and continues downward its next longer term support area is in the
9850 to 9900 range (point E) as mentioned above. 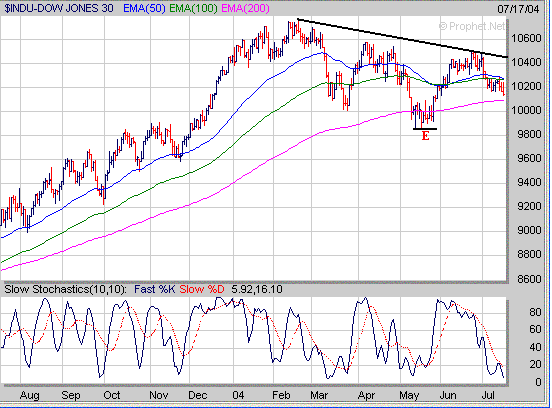
The S&P 500 on a weekly basis has a key support area in
the 1070 to 1077 area which coincides with its longer term 23.6% Retracement
Level and recent May low. As long as the S&P 500 can hold support
above 1070 that will be constructive. However if the S&P 500
eventually breaks below 1070 that could lead to a downward move back to its
longer term 38.2% Retracement Level near 1010 (point F). 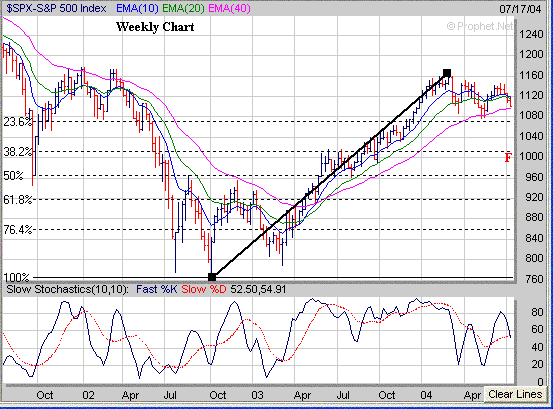
On a daily basis the S&P 500 is rather oversold based on
the Slow Stochastics. The key short term support level to watch in the
S&P 500 is at its 200 Day EMA (purple line) near 1095. If the S&P
500 holds support at this level and begins to bounce from oversold conditions
look for upside resistance to occur around 1120 which is where its 50 Day EMA
(blue line) and 100 Day EMA (green line) reside at. Meanwhile if the
S&P 500 fails to hold support near 1095 then look for the next significant
area of support at its May low near 1077 (point G). 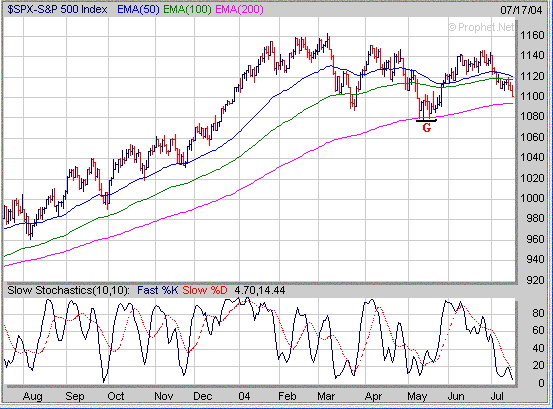
Also remember a key sector that affects the S&P 500 are
the Banks (BKX). On a weekly basis the BKX is nearing its longer term
23.6% Retracement Level just above 93. If the BKX can hold support near 93
this would be constructive in the near term however if it breaks below 93 then
look for a retest of the May low near 91 (point H). 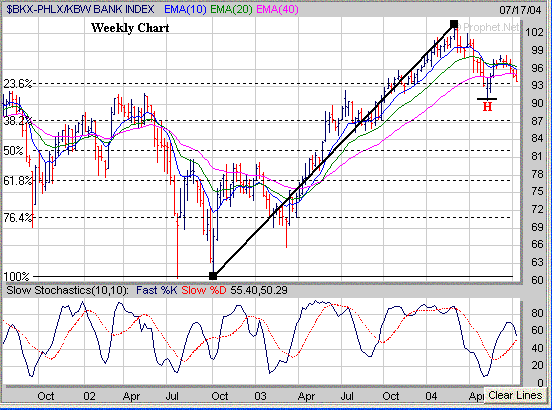
For those tracking the Gold and Silver sector (XAU) the XAU
has rallied back up to its 40 Weekly EMA (green line) after making a bottom a
few months ago near 76. If the XAU rallies above 92 I would look for the
next area of upside resistance around 96 which is along its downward sloping
trend line (solid black line) originating from the early January high.
Meanwhile if the XAU begins to pull back some I would look for support near the
86 level which is along its newly developing upward sloping trend line
originating from the May low. 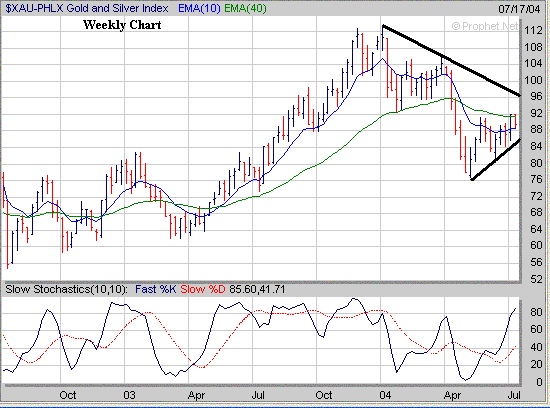
When
the market is correcting it's very important to start noticing which stocks are
holding up well and developing a favorable chart pattern versus those that
aren't. Right now you should be looking for those stocks which are forming
the right side of a Cup. A couple of stocks from my Top 100 List
that have formed the right side of a Cup and I will be watching over the next
several weeks are shown below. Notice both ASE and TXI have formed the
right side of a Cup over the past 2 years. 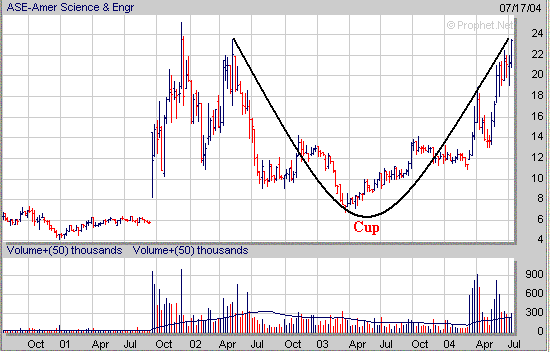
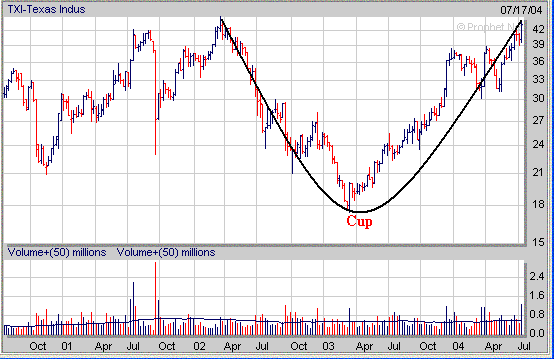
Now what I will be watching
for over the next few weeks is for both of these stocks to start developing a
constructive Handle to complete a "Cup and Handle" pattern. How can a Premium Membership to amateur-investor.net
benefit you as an investor? We focus on stocks which are exhibiting
favorable Sales and Earnings Growth that have developed a favorable chart pattern such as a
"Cup and Handle",
"Double Bottom", "Flat Base" or "Symmetrical
Triangle". These stocks are then
included in our "Stocks to Watch List" which gives investors a
quick reference to those stocks which may provide the best buying opportunities
to the long side in the weeks ahead. Each stock in
our "Stocks to Watch List"
includes specific Buy Prices, Stop Loss Prices (very important) and projected
Target Prices.
Signup
Today for a "Free" 2 Week Trial Membership
and see which Stocks to Buy or Short in the weeks ahead
Amateur-Investor.net
|

