|
Weekend Stock Market Analysis
(7/29/06) Since mid July the market has been attempting to
rally but it has been rather volatile. The Dow has rallied over 500 points
the past few weeks and now is back above its 50 Day EMA (blue
line). Meanwhile one could argue the Dow is developing a potential
Double Bottom pattern (looks like the letter W). In the near term look for
the Dow to encounter possible upside resistance next week just above the 10275
level which is where it stalled out at in late May and early June (point A). 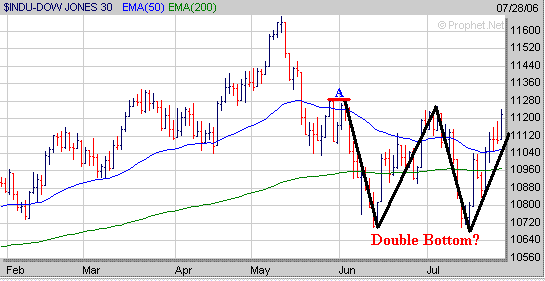
The Nasdaq found support just over a
week ago near the 2010 level and rallied back above its 20 Day EMA (purple line)
this week. If the Nasdaq can follow through next week look for strong
upside resistance to occur at its 50 Day EMA (blue line) which is around the
2130 area. Keep in mind since early May the Nasdaq has encountered
resistance either at its 200 Day EMA (point B) or 50 Day EMA (point C)
while being in a downtrend as it has been making a series of lower lows.
In order for this bearish pattern to be broken the Nasdaq would have to rise
solidly above its 200 Day EMA which is currently around the 2190
level. 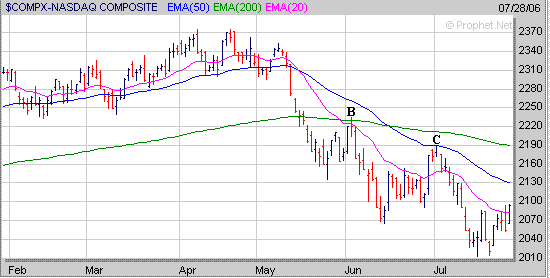
As far as the S&P 500 it has
rallied around 55 points since making a low mid July and has risen back above
its 50 Day EMA (blue line). If the S&P 500 can rise above the 1280
level next week, which is where it stalled out at in early July (point D), then
its next are of upside resistance would be around the 1290 area which is where
it stalled out at in early June (point E). Meanwhile if the S&P 500
stalls out near the 1280 level and comes under some selling pressure look for
support in the 1260-1264 range which corresponds to its 50 Day EMA and 200 Day
EMA. 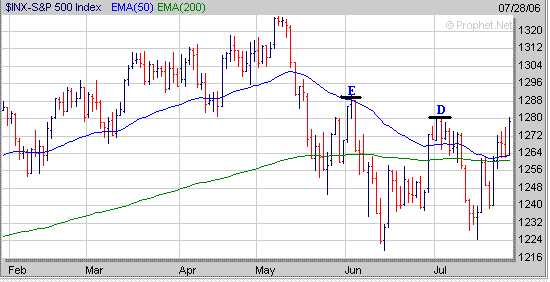
Over the past few weeks the price of
Crude Oil has pulled back some which may have helped the market rally. On
Friday the price of Crude Oil closed below its 50 Day EMA (blue line) and if it
continues to fall may eventually drop back to around the 70 level which appears
to be a key support area in the shorter term. If the price of Crude Oil
were to drop back to around 70 this may help the market continue to rally in the
near term unless a sharp upside reversal occurs. 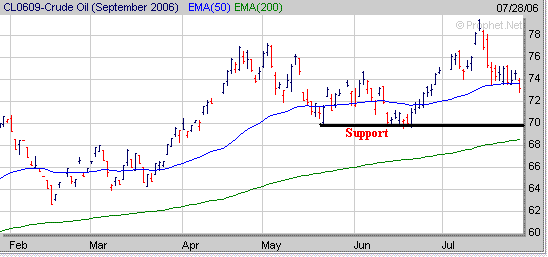
Finally although most stocks have
been selling off over the past two months a few have held up well especially in
the Financial sector. OCN was a stock which we noticed in March that
was developing a favorable Cup and Handle pattern. OCN then broke out in
late March and has been gradually moving higher over the past few months and has
gained nearly 40%. Although most stocks will trend with the market
there will always be a few exceptions. 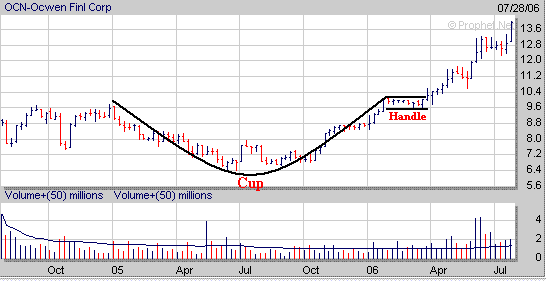
Signup today for a "Free"
2 Week Trial Membership to Amateur Investors and have access to our current Stocks to Watch Buy List which contains stocks that are currently developing a favorable chart
pattern such as the Cup and Handle, Double Bottom and Flat Base which can be used with either our Long Term
Investing Strategy or Short Term Investing
Strategy.
Also you will have access to these other investment products.
Daily Breakout Reports
Daily ETF Signals
Market Timing Indicator
Click
Here to Signup for a "Free" 2 Week Trial Membership
Send this Free Newsletter to a Friend or Relative
Amateur Investors
|


