|
Click
Here to Signup for a "Free" 30 Day Membership and have
access to our Market Timing Indicator and Stocks to Watch List
Weekend Stock Market Analysis
(7/30/05)
The major averages ended basically flat for the week as the
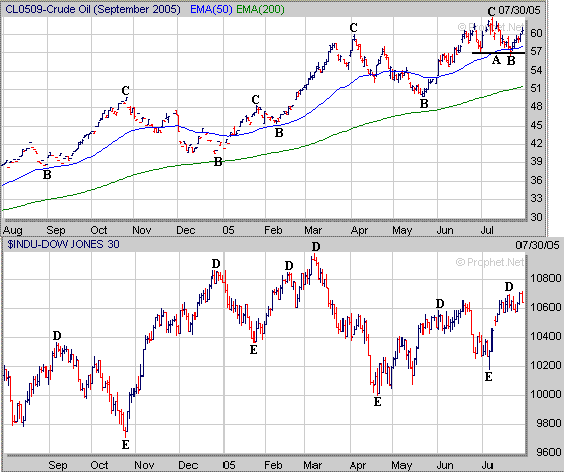
price of Crude Oil has started to bounce after finding support near the 57 level
(point A). Future action in the price of Crude Oil may have an affect on
the major averages in the weeks ahead. If the price of Crude Oil were to
rally above its previous high in the lower 60's then this could lead to the
redevelopment of selling pressure in the major averages. However if the
price of Crude Oil were to fall below the 57 level then this could lead to a
drop back to its 200 Day EMA (green line) just above 51 which may have a
positive affect on the major averages and allow for them to continue higher in
the longer term. As we have seen over the past two
years the rise or fall in the price of Crude Oil has had an affect on the
Dow. When the price of Crude Oil has rallied (points B to C) this has
generally led to a correction in the Dow (points D to E) and when the price of
Crude Oil has fallen (points C to B) this has generally led to a rally in the
Dow (points E to D).
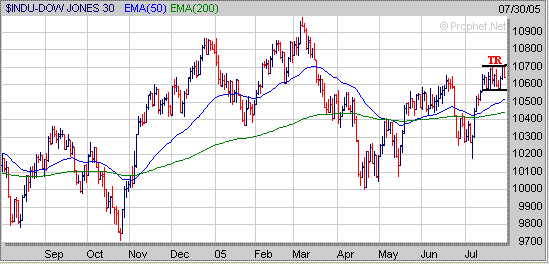
 In the near term the Dow has
basically been in a small trading range (TR) the past two weeks between 10570
and 10700. Eventually it will break out of this trading and either make a
move higher or lower. If the Dow rallies solidly above 10700 then it may
rise up to the 10850 to 11000 range. Meanwhile if the Dow drops below
10570 then I would expect a drop back to its 50 Day EMA (blue line) near 10500
or its 200 Day EMA (green line) just below 10450.
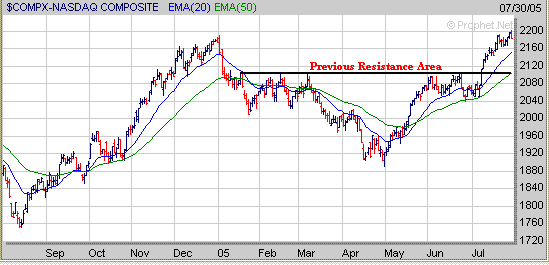
The Nasdaq has risen just above its previous early January intra day high which
was around 2190. If the Nasdaq comes under some selling pressure I would
look for initial support at its rising 20 Day EMA (blue line) near 2155. If the
Nasdaq dropped below its 20 Day EMA then it's next area of support would be
around 2100 which corresponds to its 50 Day EMA (green line) and also acted as a
previous resistance area.
Meanwhile if the Nasdaq holds support at or above its 20 Day EMA and continues
higher it's somewhat subjective at this point to determine where its next upside
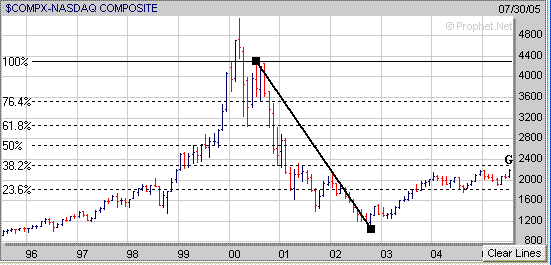
resistance area may reside at in the shorter term. If we draw in some
longer term Retracement Levels (calculated from the 2000 high to the 2002 low)
it's obvious the Nasdaq isn't going to rally up to the 38.2% Retracement Level
near 2600 (point F) in the shorter term as that would be a 400 point
move.
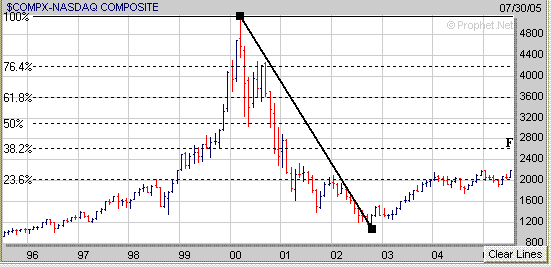
However if we draw in some Retracement Levels from where the Nasdaq stalled out
in the Summer of 2000 (point F), after selling off strongly beginning in early
2000, to the low in 2002 the 38.2% Retracement Level is near 2300 (point
G). Thus this level appears to be a more realistic upside resistance area
for the Nasdaq in the shorter term if it continues higher.
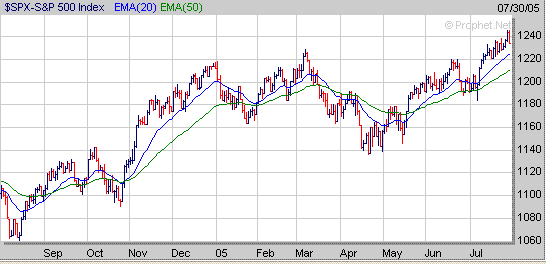
 As for the S&P 500 it made a new
52 week high this week however if it does come under some selling pressure I
would look for initial support at its rising 20 Day EMA (blue line) near
1225. If the S&P 500 were to drop below 1225 then its next area of
support would be at its rising 50 Day EMA (green line) near 1210.
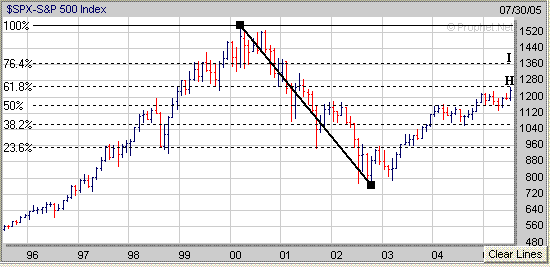
Meanwhile from a longer term perspective the S&P 500 is nearing its 61.8%
Retracement Level (calculated from the 2000 high to the 2002 low) which is
around 1255 (point H). The question is will the S&P 500 be able to
break above this major upside resistance level or will it stall out at this
level? If the S&P 500 were able to break solidly above the 1255 level
it appears its next major upside resistance level would be at its 76.4%
Retracement Level near 1360 (point I).
As mentioned in the beginning the future price of Crude Oil may have a
significant impact on how the major averages act over the next several weeks. Finally
if you aren't certain which stocks to invest and are looking for some help you may find our Premium
Membership Services helpful. Although the market has been
challenging so far in 2005 we continue to outperform the major averages as shown
below by focusing on in stocks with good Sales and Earnings Growth that are
breaking out of a favorable chart pattern.
| Performance versus the Major Averages
(1/1/05-7/29/05) |
| Amateur
Investors (Long + Short Positions):
+20.6% |
| Dow:
-1.3% |
| Nasdaq:
+0.4% |
| S&P
500:
+1.8% |
Signup today for a Free
30 Day Membership to amateur-investor.net and have access to the
following useful investment products.
Stocks to Watch Buy List
Daily Breakout Reports
Market Timing Indicator
Weekly ETF Buy and Sell Signals
Click
Here to Signup for a "Free" 30 Day Membership
Amateur-Investor.net
|


