|
Signup
today and save 50% on a Premium Membership Plan
which includes our Stocks to Watch List and Daily Breakout Reports
Weekend Stock Market Analysis
(7/3/04)
The main sector I'm focusing on right now is the Semiconductors
as the Semiconductor Holders (SMH) ran into strong resistance this week along
their downward sloping trend line (solid brown line) established from the
January high. The SMH's then sold off strongly on Thursday and then broke
short term support on Friday at their June low near 35.75 (point A).
Although the SMH's could bounce a bit early next week the path of least
resistance suggests that the early May low near 34.50 (point B) is where they
are headed. 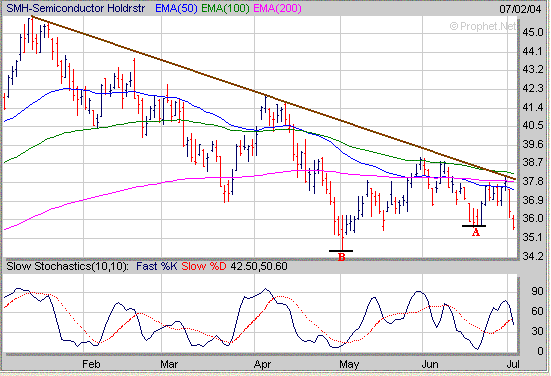
Furthermore the
34.50 level (point C) is a key longer term support area for the SMH's as this is
where their 38.2% Retracement Level (calculated from the October 2002 low to the
January 2004 high) comes into play at. If the SMH's retest the 34.50 area
and can hold support then this would be a positive sign for the longer
term. However if they break below solidly below 34.50 then they will
likely drop back to their longer term 50% Retracement Level near 31.50 (point
D). 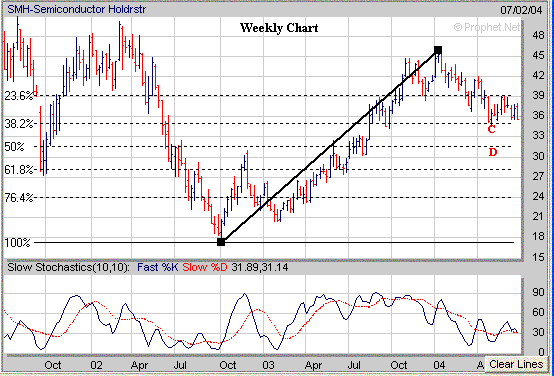
Some other sectors
to watch are the Banks (BKX) and the Broker/Dealers (XBD). The BKX so far
has held support above its 200 Day EMA (purple line) near 95 but has encountered
resistance over the past month near 98.25 (point E). If the BKX
breaks below its 200 Day EMA this would likely lead to an eventual retest of its May low
near 91 (point F) and would have a negative impact on the S&P 500.
Meanwhile if the BKX can hold support above its 200 Day EMA and eventually break
above its previous resistance level near 98.25 then this would have a positive
affect on the S&P 500 in the longer term. 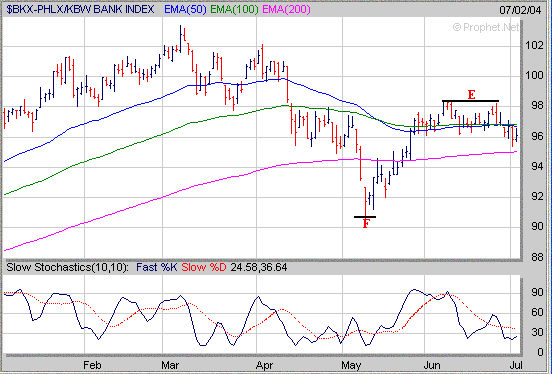
The Broker/Dealers (XBD)
have a key longer term support area near 120 and this level must hold for them
to be constructive. If the XBD breaks below 120 that would spell trouble
for the market. Meanwhile if the XBD can hold support near 120 and
eventually break above the 130 area which is where its 100 Day EMA (green line)
resides at then this would be a positive for the market. 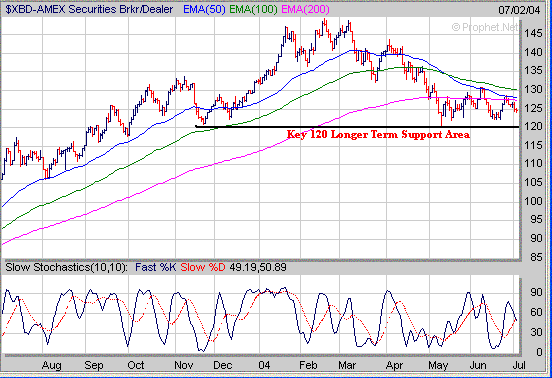
As far as the major
averages the Dow is at a critical short term support area near 10260. If
the Dow breaks below 10260 this could lead to a drop back to its 200 Day EMA
(purple line) near 10080. Meanwhile if the Dow is able to hold support near 10260
and begins to reverse to the upside look for resistance around the 10450
area. 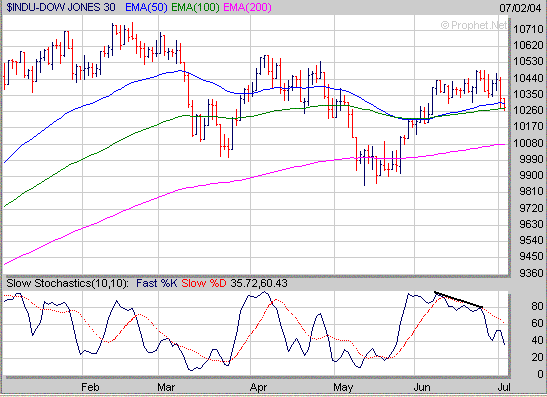
The
Nasdaq also came under selling pressure on Thursday and Friday but so far has
remained above its 50 Day EMA (blue line) and 100 Day EMA (green line) which are
in the 1980 to 1990 range. If the Nasdaq fails to hold support near 1980
then its next level of downside support would be at the June low near 1960 (point
G). One disturbing thing that I'm seeing in the Nasdaq is that its %K Line
in association with the Slow Stochastics made a lower high (point H) as the
Nasdaq moved higher in late June (point I). This type of negative
divergence usually isn't a good sign. 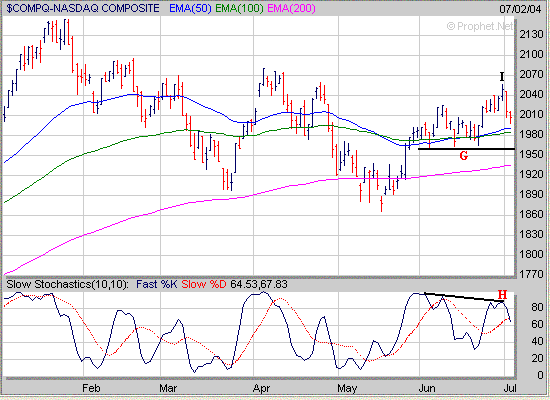
Meanwhile the
Volatility Index (VXN) which tracks the Nasdaq 100 still needs to be watched for
a significant break above the 20.75 area (point J) which could lead to a
substantial upward move like occurred this past March (points K to L) and April
(points M to N). 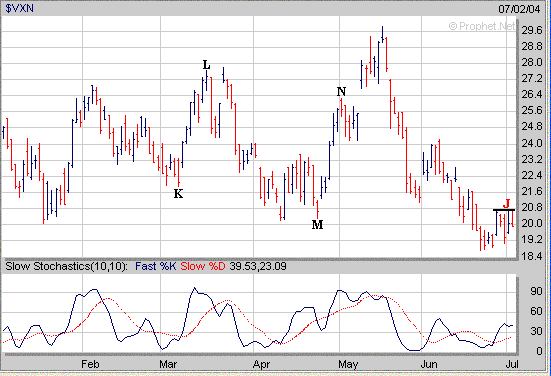
The S&P 500 so
far has held support above its 100 Day EMA (green line) near 1120 and it will be
critical for it to hold support near this level next week. If the S&P
500 breaks below 1120 this could lead to a quick drop back to its 200 Day EMA
(purple line) near 1090. 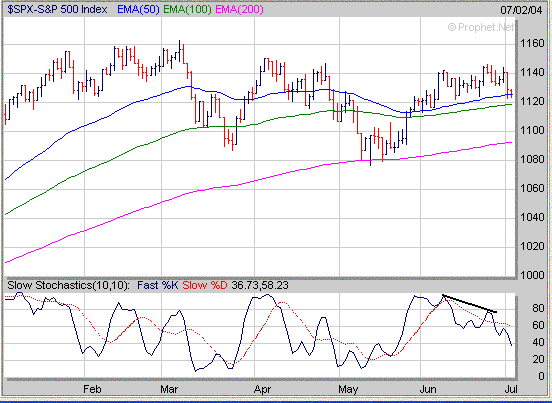
How can a Premium Membership to amateur-investor.net
benefit you as an investor? We focus on stocks which are exhibiting
favorable Sales and Earnings Growth that have developed a favorable chart pattern such as a
"Cup and Handle",
"Double Bottom", "Flat Base" or "Symmetrical
Triangle". These stocks are then
included in our "Stocks to Watch List" which gives investors a
quick reference to those stocks which may provide the best buying opportunities
to the long side in the weeks ahead. Each stock in
our "Stocks to Watch List"
includes specific Buy Prices, Stop Loss Prices (very important) and projected
Target Prices.
Signup
Today for a "Free" 2 Week Trial Membership
and see which Stocks to Buy or Short in the weeks ahead
Amateur-Investor.net
|

