|
Weekend Stock Market Analysis
(6/10/06)
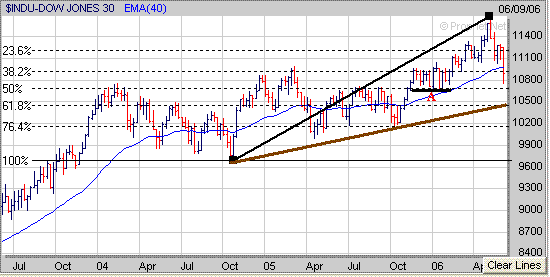
The major averages have been in a correction during the past
five weeks. The Dow has dropped around 900 points or 7.8% since peaking in
early May and failed to hold support at its 40 Weekly EMA (blue line) this week.
If the Dow remains under more selling pressure the next area of support appears
to be at its 50% Retracement Level (calculated from the October 2004 low to its
most recent high) near 10700. The 10700 level is also where the Dow found
support at in the late part of 2005 into the early part of 2006 as well (point
A). If the Dow fails to hold support at the 10700 level then the next
downside support area would be just below 10500 which corresponds to its 61.8%
Retracement Level and upward sloping trend line (brown line) originating from
the October 2004 low.
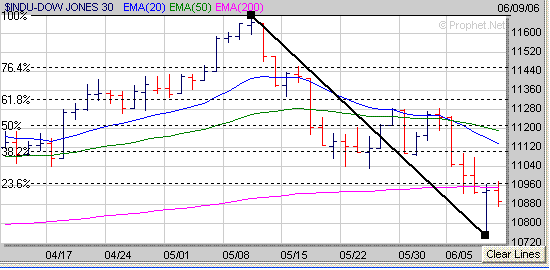
 Meanwhile if the Dow attempts to bounce from oversold conditions
next week look for its first level of resistance in the 11000 to 11200 range.
The 11000 area is where the Dow's falling 20 Day EMA (blue line) is nearing and
is also where the 38.2% Retracement Level (calculated from the early May high to
the most recent low) is close to as well. Meanwhile the 11200 area is
where the Dow's 50 Day EMA (green line) resides at and is also near its 50%
Retracement Level.
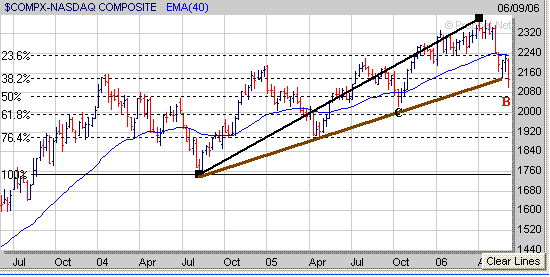
The Nasdaq has fallen around 275 points or 11.6% since peaking in early April
and broke below a key longer term support level this week near the 2135 area.
The 2135 area corresponded to the Nasdaq's 38.2% Retracement Level (calculated
from the August 2004 low to the April 2006 high) and also was along its upward
sloping trend line (brown line) originating from the August 2004 low as well.
If the Nasdaq remains under more selling pressure its next level of support
would either be at its 50% Retracement Level near 2060 (point B) or at its
October 2005 low near 2030 (point C).
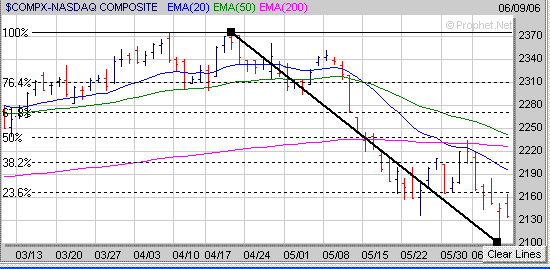
 Meanwhile if the Nasdaq attempts to rally next week from
oversold conditions look for initial resistance to occur in the 2195 to 2205
area. The 2195 area is where the Nasdaq's falling 20 Day EMA (blue line)
resides at while the 2205 level is where its 38.2% Retracement Level (calculated
from the April high to the most recent low) comes into play at. If the
Nasdaq were to rise above the 2205 level then look for even stronger resistance
at its 200 Day EMA (purple line) near 2225.
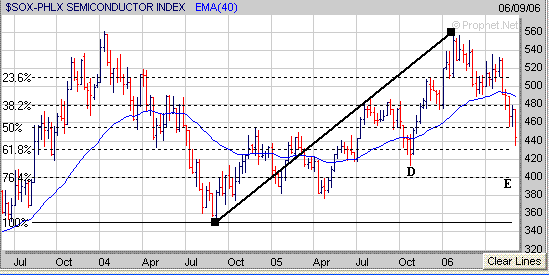
One reason the Nasdaq has been clobbered of late is due to the weakness in the
Semiconductors. The Semiconductor Index (SOX) continues to act very poorly
and is now approaching a key support level near the 430 area which corresponds
to its 61.8% Retracement Level (calculated from the September 2004 low to the
January 2006 high). If the SOX fails to hold support near the 430 level
then look for it to eventually drop back to either its October 2005 low near 410
(point D) or its 76.4% Retracement Level near 400 (point E). As long as
the SOX remains under selling pressure the Nasdaq is likely going to trend lower
as well. Thus I think next week will be a crucial week for the SOX as it
must hold support near the 430 level.
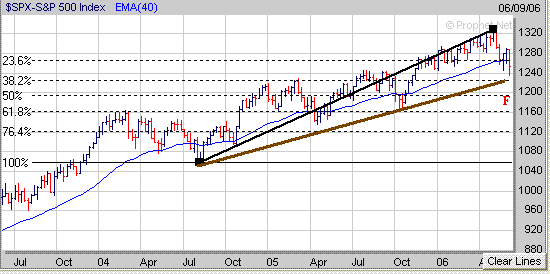
 As far as the S&P 500 it has fallen around 90 points or 7% the
past five weeks and also has broken below its 40 Weekly EMA (blue line).
However so far the S&P 500 has held support above the 1230 level which is an
important longer term support area that coincides with its upward sloping trend
line (brown line) originating from the August 2004 low and its 38.2% Retracement
Level (calculated from the August 2004 low to the most recent high). Thus
it's going to be important for the S&P 500 to hold support near the1230 level
over the next few weeks. If the S&P 500 were to break below the 1230 level
then its next area of support would be at its 50% Retracement Level just below
the 1200 level (point F).
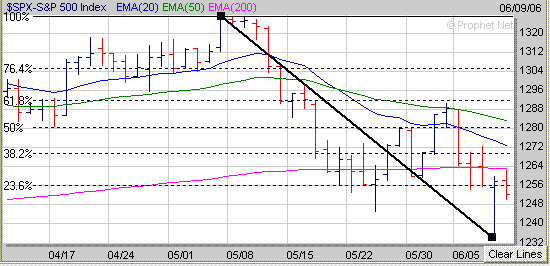
 Meanwhile if the S&P 500 can hold support at or above the 1230
level and then begins to rally from oversold conditions look for initial
resistance in the 1270 to 1272 range. The 1270 area is at the S&P 500's
38.2% Retracement Level (calculated from the early May high to the most recent
low) while the 1272 level is at its falling 20 Day EMA (blue line). If the
S&P 500 were able to rise above the 1272 area look for even stronger resistance
to occur in the 1280 to 1283 range. The 1280 level is at the S&P 500's 50%
Retracement Level while the 1283 area corresponds to its 50 Day EMA (green
line).
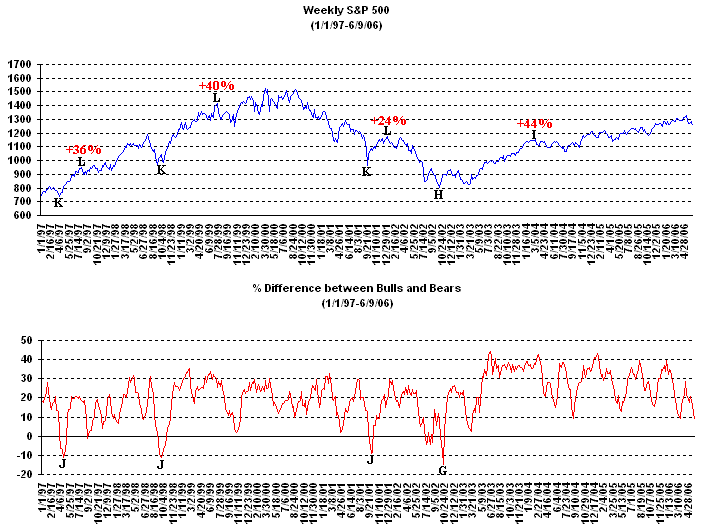
Over the past few weeks there has been a gradually increase in pessimism among
investors as the Put to Call Ratio has been well above the 1.0 level while the
Volatility Index (VIX) has risen substantially as well. One indicator that
has been useful in signaling a meaningful bottom during the past several years
has been the % difference between the Bullish and Bearish Investment Advisors.
In the past when the % of Bearish Investment Advisors has equaled or exceeded
the % of Bullish Investment Advisors the market has made a bottom which was then
followed by a substantial rally. The last time the % of Bearish Investment
Advisors exceeded the % of Bullish Investment Advisors was in the Fall of 2002
(point G) as the S&P 500 made a bottom (point H) which was then followed by a
substantial rally (points H to I) in which it gained over 40% during the next 18
months. Meanwhile as you can see below it's very rare to see the % of
Bearish Advisors greater than the % of Bullish Investment Advisors (points J)
however when it does occur the S&P 500 has rallied strongly in the past (points
K to L).
Currently the % of Bullish Investment Advisors is higher than
the % of Bearish Investment Advisors by around 10%. However it will be
interesting to watch this over the next 2 to 4 weeks to see if the % of Bearish
Investment Advisors eventually outnumbers the % of Bullish Investment Advisors.
 I know the past five weeks has been frustrating to many
investors however now isn't the time to panic and give up on the market.
Corrections are always going to happen and generally clear the way for a new
group of stocks to emerge as market leaders once a bottom does occur.
Right now just be patient and keep a close eye on those stocks which are holding
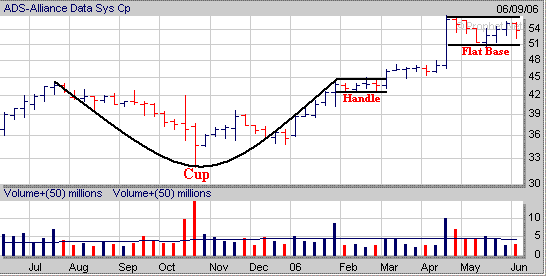
up the best and developing a favorable chart pattern. For example
ADS from our current Stocks to Watch List has developed a 7 week Flat Base
pattern after previously breaking out of a Cup and Handle pattern back in early
March.
Signup today for a "Free"
2 Week Trial Membership to Amateur Investors and have access to
all of the Stocks in our current Stocks to Watch Buy List which contains stocks that are currently developing a favorable chart
pattern such as the Cup and Handle, Double Bottom and Flat Base which can be used with either our Long Term
Investing Strategy or Short Term Investing
Strategy.
Also you will have access to these other investment products.
Daily Breakout Reports
Market Timing Indicator
Daily ETF Buy and Short Signals
Click
Here to Signup for a "Free" 2 Week Trial Membership
Send this Free Newsletter to a Friend or Relative
Amateur Investors
|


