|
Click
Here to save 50% on Premium Membership to amateur-investor.net
and have access to our Stocks to Watch List and Daily Breakout Reports
Weekend Stock Market Analysis
(6/11/05)
The major averages pulled back some this week but held up rather
well after rallying strongly in May. The Dow has been
holding support near its 50 Day EMA (blue line) while basically trading nearly
sideways the past few weeks. Eventually this trading range will be
resolved with two possible outcomes. The first scenario would be for the
Dow to hold support near 10400 which corresponds to its 200 Day EMA (green line)
and then eventually rally up to its next level of upside resistance just below
10700 (point A) which corresponds to its 23.6% Retracement Level (calculated
from the October 2004 low to the early March high). Meanwhile the second
scenario would be for the Dow to break below its 200 Day EMA near 10400 and then
drop back to either its 50% Retracement Level near 10350 (point B) or its 61.8%
Retracement Level around 10200 (point C). 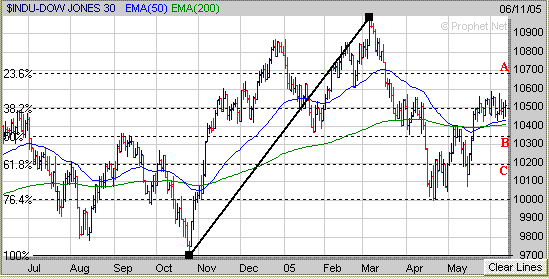
The thing I will be watching which
may affect the Dow is the price of Crude Oil. The Dow began to trade
sideways as the price of Crude Oil started to rally in late May as it held
support near its 200 Day EMA (green line). So far the price of Crude Oil
has been holding support at its 50 Day EMA just above 52.50. If the price
of Crude Oil breaks above 55.50 then I would expect it to rally back to its
previous high near 60 that occurred in early April (point D). This could
have a negative affect on the Dow as it may come under renewed selling pressure.
Meanwhile if the price of Crude Oil drops back below its 50 Day EMA then I would
expect it to eventually retest its 200 Day EMA near 48 which may have a positive
affect on the Dow and allow it to rally up to around the 10700 area mentioned
above. 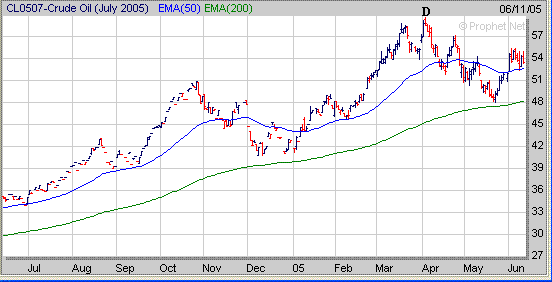
The Nasdaq which stalled out near
the 2100 level for the third time since February so far has held support near
its rising 20 Day EMA (blue line) around 2050. If the Nasdaq can hold
support near its 20 Day EMA and begins to rally once again look for upside
resistance near 2100. In the longer term if the Nasdaq can eventually break above the
significant 2100 resistance level then it may have a chance to rally up to its
previous early January high around 2190. Meanwhile if
the Nasdaq fails to hold support near its 20 Day EMA then its next area of
support would be in the 2010 to 2025 range. The 2025 area is where the
Nasdaq's 50 Day EMA (green line) and 38.2% Retracement Level (calculated from
the August 2004 low to the early January high) reside at while the 2010 area
coincides with its 200 Day EMA (purple line). 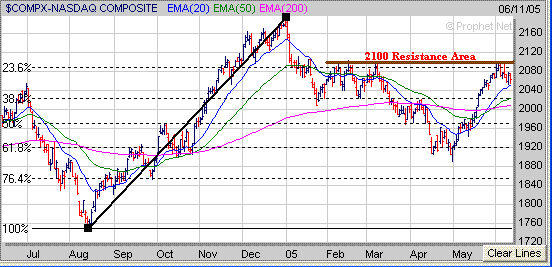
The one sector to watch closely
which will likely have a significant impact on the Nasdaq is the
Semiconductors. The Semiconductor Holders (SMH) are exhibiting two
potential chart patterns at this time with one being potentially bullish and the
other potentially bearish. Looking at the bullish case
first one could say the SMH's have formed a Double Bottom pattern (looks like
the letter "W"). Now what I would like to see is for the SMH's
to develop a constructive Handle over the next few weeks while holding support
near the 33 level which is near its 10 Weekly EMA (blue line) and 40 Weekly EMA
(green line). If this scenario pans out and the SMH's eventually rally
strongly above the 35 level then their next level of upside resistance would be
in the 38 to 39 range. If the SMH's can rally up to the 38 to 39 level in
the longer term this would likely have a positive affect on the Nasdaq and
probably allow it to rally back up to the 2190 level mentioned
above. 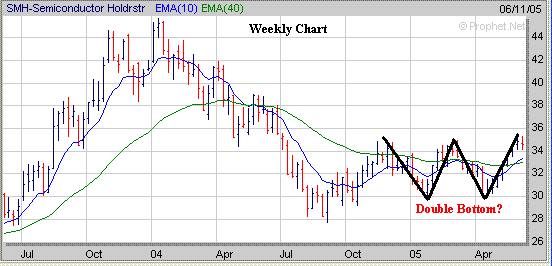
Meanwhile if we examine the bearish
case one could also say the SMH's have formed a potential Triple Top
pattern. As mentioned above the key support level to watch is around
33. If the SMH's drop below 33 then this would likely lead to a retest of
the early April low near 30 (point E) and would have a negative affect on the
Nasdaq in the longer term. 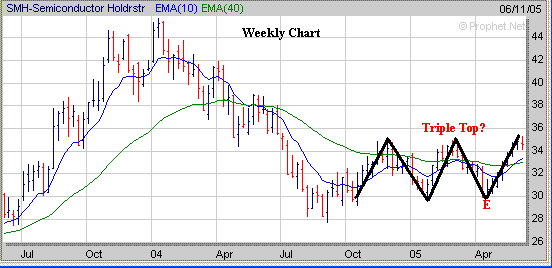
As for the S&P 500 so far its
has been holding support near 1190 which is where its 20 Day EMA (blue line) and
23.6% Retracement Level (calculated from the August 2004 low to the early March
high) reside at. If the S&P 500 can hold support near 1190 and then
eventually rally above the 1210 area then it may have a chance to reach its
previous high near 1230 in the longer term. Meanwhile if the S&P 500
drops below the 1190 area then its next area of support would be just above 1180
which is at its 50 Day EMA (green line). In the longer term if the S&P
500 was unable to hold support near 1180 then its next area of support would be
near 1165 which is where its 200 Day EMA (purple line) and 38.2% Retracement
Level reside at. 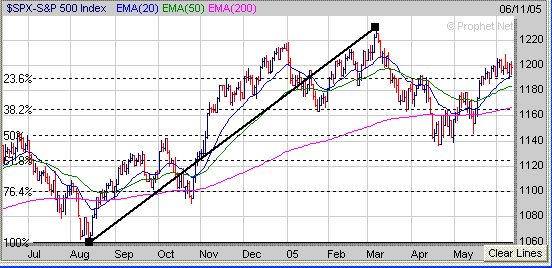
To
sum things up I will be watching the price of Crude Oil and the Semiconductors
over the next few weeks. If the price of Crude Oil comes under selling
pressure and the Semiconductors can rally strongly above the 35 level then this
would be a big positive for the major averages. However if the price of
Crude Oil rises back to its previous high near 60 and the Semiconductors sell
off then this would spell trouble for the major averages. Finally
keep an eye on those stocks which are forming a favorable chart pattern such as
the Cup and Handle or Double Bottom. A couple of stocks from our current
watch list are exhibiting these patterns. BMR has formed a
Double Bottom pattern (looks like the letter "W") and needs to develop
a constructive Handle over the next few weeks before moving higher. 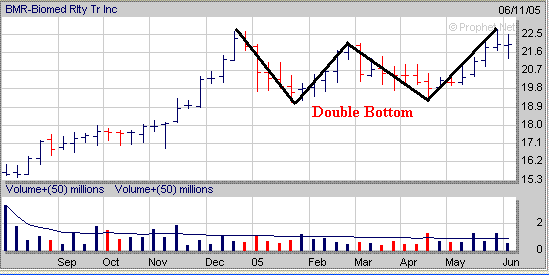
Meanwhile OPWV has formed the right
side of a 6 month Cup and also needs to work on developing a constructive Handle
over the next few weeks before moving higher. 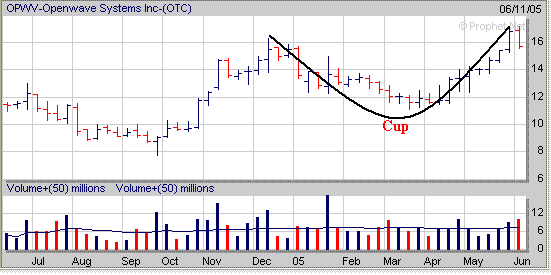
Finally our 50% Off Introductory Special for New Members will
expire at the end of this month. Since going online in late 1999 we have
been providing a list of stocks to buy which focuses on stocks that have decent
Sales and Earnings Growth that are exhibiting a favorable chart pattern such as
the "Cup and Handles", "Double Bottoms" and "Flat
Bases".
Our Performance Statistics versus the Major Averages are
shown below going back to 2000.
(2005 Results are only through the month of May)
| Year |
2005 |
2004 |
2003 |
2002 |
2001 |
2000 |
Amateur
Investors |
+16.5% |
+68.8% |
+119.3% |
+48.9% |
+51.3% |
+277.3% |
| Dow |
-2.2% |
+3.1% |
+25.3% |
-16.7% |
-7.1% |
-6.2% |
| Nasdaq |
-4.6% |
+8.6% |
+50.0% |
-31.5% |
-21.0% |
-39.2% |
| S&P 500 |
-1.1% |
+9.0% |
+26.4% |
-23.3% |
-13.0% |
-10.1% |
In addition A Premium Membership to Amateur-Investor.net
allows you to have access to our ETF
Weekly Timing Indicator and Market
Timing Indicator (MTI) as well.
Click
Here to save up to 50% on a Premium Membership
or to signup for a "Free" 2 Week Trial Membership
Amateur-Investor.net
|


