|
Signup
today and save 50% on a Premium Membership Plan
which includes our Stocks to Watch List and Daily Breakout Reports
Weekend Stock Market Analysis
(6/12/04)
I'm watching the Volatility Index (VIX) very closely as a drop
back to 14 or below could signal a nearing top in the market. Remember the
last three times the VIX has dropped to 14 or below (points A) this has been
followed by some type of sell off of differing magnitudes (-3.4%, -6.0% and
-6.0%) in the S&P 500. 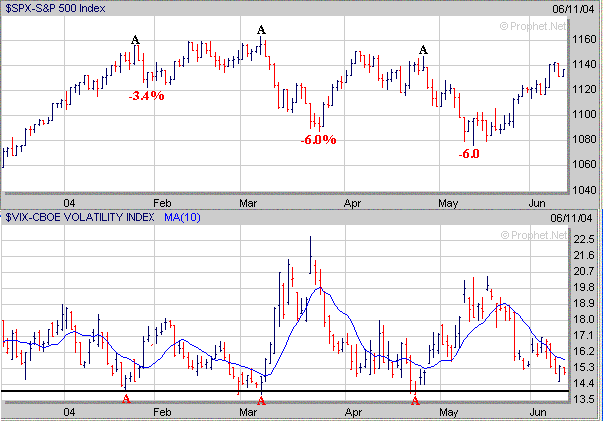
As far as the major averages the Dow
has rallied back to around its 61.8% Retracement Level near 10400 (calculated
from the February high to the May low). If the Dow can rally above 10425
it should be able to rise back to its April high near 10550 (point B).
Meanwhile if the Dow peaks around 10400 and comes under some selling pressure
look for initial support around 10250 which is where its 50 Day EMA (blue line)
and 100 Day EMA (green line) have converged at. 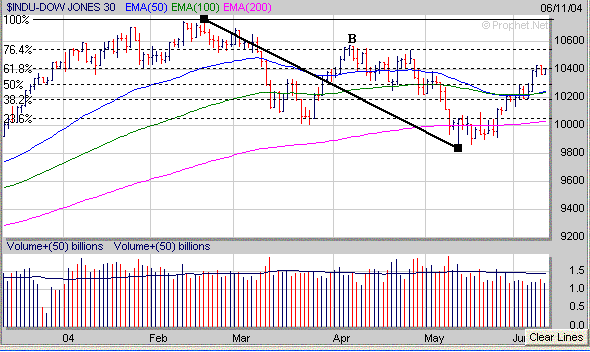
The Nasdaq stalled out this past
week near its downward sloping trend line around 2025 (solid gray line)
established from the January high. If the Nasdaq can break solidly above
this trend line then look for a potential upward move to the 2060 (point C) to 2080
(point D) range which would be the next levels of upside resistance.
Meanwhile if the Nasdaq encounters selling pressure look for initial support
either at 1975 which is where its 50 Day EMA (blue line) and 100 Day EMA
(green line) have converged at or around 1960 (point E) which has been the June
low so far. 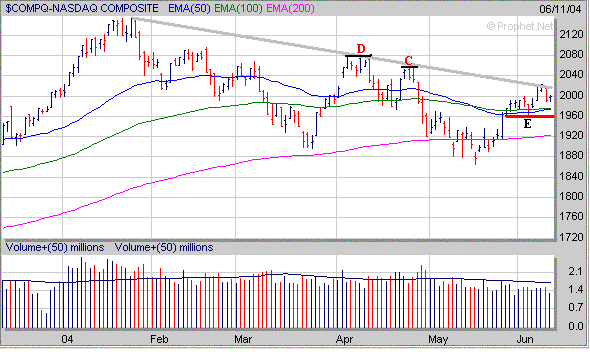
A sector that will have a
significant impact on the Nasdaq is the Semiconductors. A look at the
Semiconductor Holders (SMH) shows that their downward and upward sloping trend
lines (solid black lines) are beginning to converge which tells me they are
getting close to making a substantial move in one direction or the other.
Over the past few weeks the SMH's have been encountering resistance near their
100 Day EMA (green line) just below 39. If the SMH's can break solidly above
the 39 level this would be a Bullish sign with a possible rally up to their
April high near 42 (point F) and would have a positive affect on the Nasdaq.
Meanwhile if the SMH's break below the 37 level then this will likely lead to an
eventual retest of the early may low near 34.50 and thus have a negative affect on
the Nasdaq. 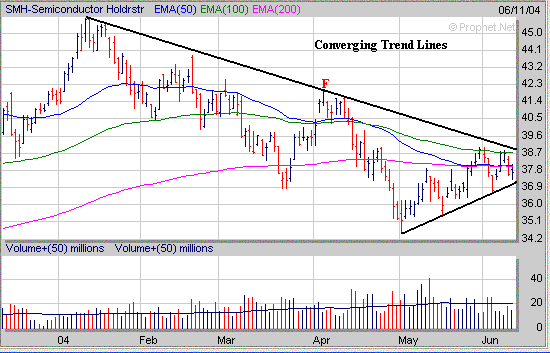
The S&P 500 stalled out near the
1140 area this week. If the S&P 500 rallies above 1140 it should be
able to rise back up to its April high around 1152 (point G) or possibly as high
as its May high near 1163 (point H). Meanwhile if the S&P 500 tops out
in the near term and comes under some selling pressure look for initial support
in the 1115 to 1120 area which coincides with its 100 Day EMA (green line) and
50 Day EMA (blue line). 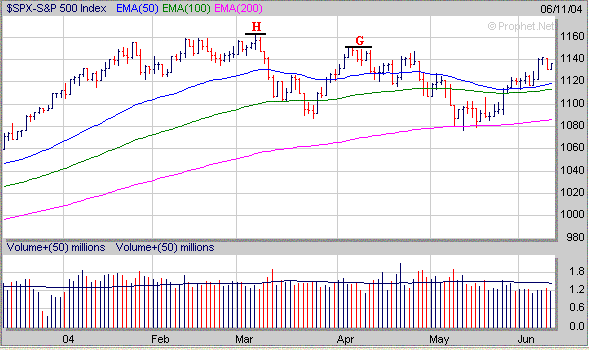
One sector that will have a
substantial affect on the S&P 500 is the Banking sector (BKX). The BKX
has rallied back to its 61.8% Retracement Level near 98.50 (calculated from the
March high to the May low). If the BKX can break solidly above 98.50 look
for a potential rally up to the 102 level which would have a positive affect on the
S&P 500. Meanwhile a key support area to watch in the BKX is just below
97 which is where its 50 Day EMA (blue line) and 100 Day EMA (green line) have
converged at. If the BKX falls below 97 this could lead to a drop back to its 200
Day EMA (purple line) just below 95 which would have a negative affect on the
S&P 500. 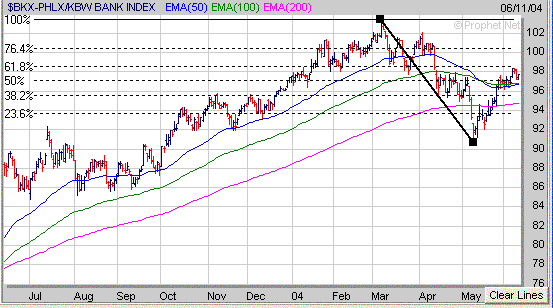
Finally
continue to watch the Oil sector (OIX) closely as well. As I mentioned a
few weeks ago the OIX had formed the right side of a 3 year Cup and it has now
developed a 5 week Handle (H). If the OIX breaks above the 355 level
(Pivot Point) then this would likely lead to selling pressure in the market as
rising Oil Prices would have a negative impact on our economy. Meanwhile
the key support level to watch in the weeks ahead is near 335 which is at the
bottom of the 5 week Handle and is close to the OIX's 20 Weekly EMA (blue
line). If the OIX breaks below 335 this would likely lead to a drop back
to its 40 Weekly EMA near 320 and negate the Bullish looking "Cup and
Handle" pattern and potentially have a positive affect on the
market. 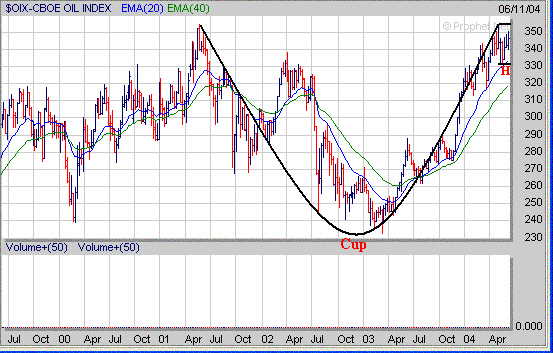
How can a Premium Membership to amateur-investor.net
benefit you as an investor? We focus on stocks which are exhibiting
favorable Sales and Earnings Growth that have developed a favorable chart pattern such as a
"Cup and Handle",
"Double Bottom", "Flat Base" or "Symmetrical
Triangle". These stocks are then
included in our "Stocks to Watch List" which gives investors a
quick reference to those stocks which may provide the best buying opportunities
to the long side in the weeks ahead. Each stock in
our "Stocks to Watch List"
includes specific Buy Prices, Stop Loss Prices (very important) and projected
Target Prices.
Signup
Today for a "Free" 30 Day Trial Membership
and see which Stocks to Buy or Short in the weeks ahead
Amateur-Investor.net
|

