|
Weekend Stock Market Analysis
(6/17/06)
After nearly six weeks of selling we finally got a decent bounce this week which
began on Wednesday as the market had become very oversold. A longer term
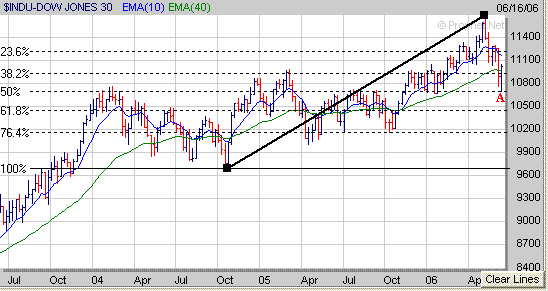
weekly chart of the Dow shows that at least in the near term it has found
support at its 50% Retracement Level (calculated from the October 2004 low to
the May 2006 high) near 10700 (point A). Now the question is can the Dow
follow through to the upside over the next few weeks or will this latest bounce
from oversold conditions fizzle out and eventually lead to more selling
pressure.
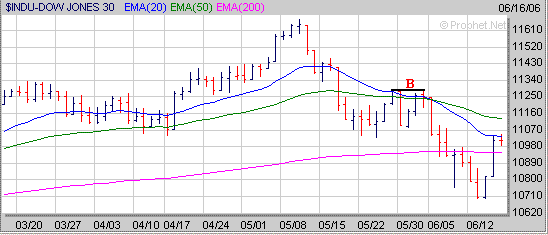
If the Dow does follow through to the upside next week look for possible
resistance to occur either at its 50 Day EMA (green line) near 11130 or where it
stalled out at a few weeks ago near 11275 (point B).
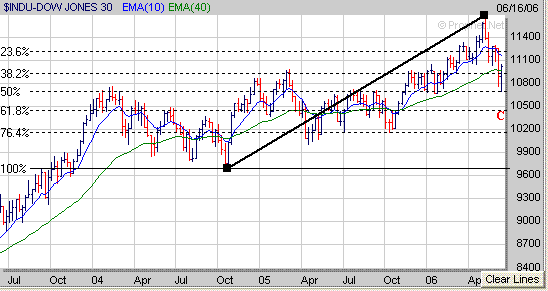
Meanwhile if this latest bounce from oversold conditions fizzles and the the Dow
begins to come under more selling pressure look for initial support at this
weeks low which was around 10700. If the Dow were to break below the 10700
level then its next area of downside support would be at its 61.8% Retracement
Level near 10450 (point C).
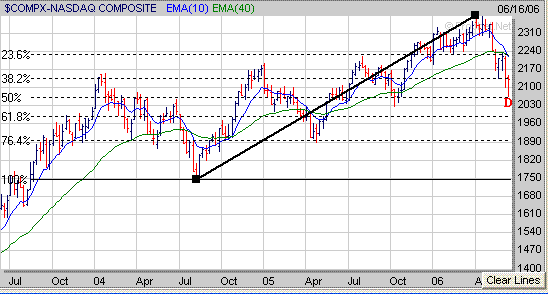
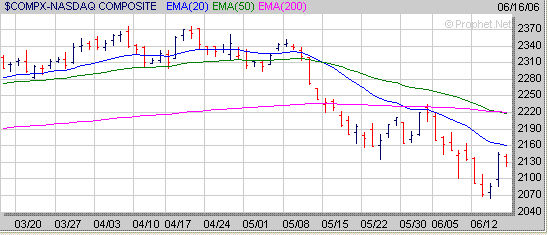
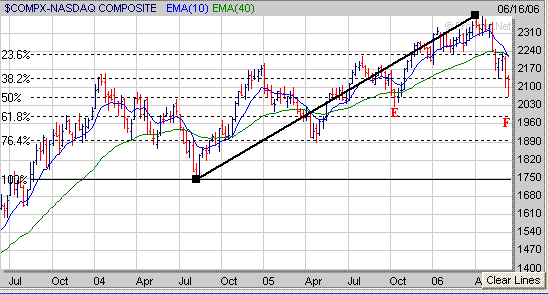
The Nasdaq appears to have found support in the near term at its longer term 50%
Retracement Level (calculated from the August 2004 low to its April 2006 high)
near 2060 (point D) after dropping over 300 points since mid April.
If the Nasdaq attempts to follow through to the upside next week look for
initial resistance to occur at its 20 Day EMA (blue line) near 2060. If
the Nasdaq can find a way to rise above the 2160 level then it has an even
stronger area of upside resistance near 2220 which corresponds to its 50 Day EMA
(green line) and 200 Day EMA (purple line).
Meanwhile if the Nasdaq stalls out near its current level and then comes under
more selling pressure look for initial support at its 50% Retracement Level near
2060. If the Nasdaq breaks below the 2060 level then its next area of
downside support would either be at its October 2005 low near 2030 (point E) or
at its 61.8% Retracement Level just below 2000 (point F).
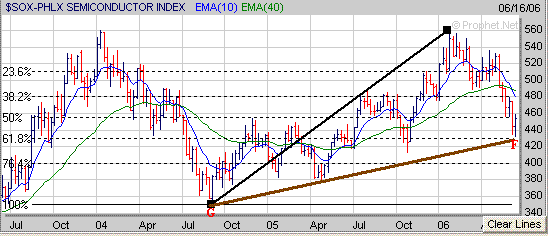
As I have talked about in the past the once sector that can have a significant
impact on the Nasdaq is the Semiconductors. The Semiconductor Index (SOX)
so far has held support at a key support level near 430 (point F) which
coincides with its longer term 61.8% Retracement Level (calculated from the
September 2004 low to the January 2006 high) and upward sloping trend line
(brown line). If the SOX can follow through to the upside over the next
few weeks look for upside resistance to occur at its 10 Weekly EMA (blue line)
near 480. Meanwhile if the SOX is unable to hold support at the 430 level
and continues lower then we could see it eventually drop back to its September
2004 low near 350 (point G) which would have a negative impact on the Nasdaq as
well.
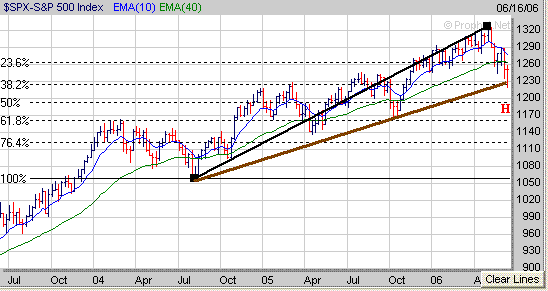
The S&P 500 held support just below the critical 1230 level this week
which coincided with its 38.2% Retracement Level (calculated from the August
2004 low to the May 2006 high) and upward sloping trend line (brown line)
originating from the August 2004 low.
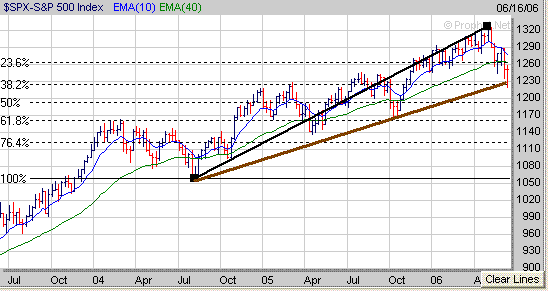
If the S&P 500 attempts to follow through next week to the upside there is an
upside resistance area near 1260 which corresponds to its 20 Day EMA (blue line)
and 200 Day EMA (purple line). If the S&P 500 is able to rise above the
1260 level then its next area of upside resistance would be at its 50 Day EMA
(green line) near 1275.
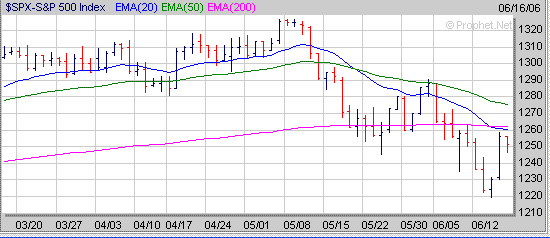
Meanwhile if the S&P 500 stalls out near its current level and then comes under
more selling pressure look for initial support just below the 1230 level.
If the S&P 500 breaks solidly below the 1230 level then its next area of
downside support would be at its 50% Retracement Level near 1190 (point H).
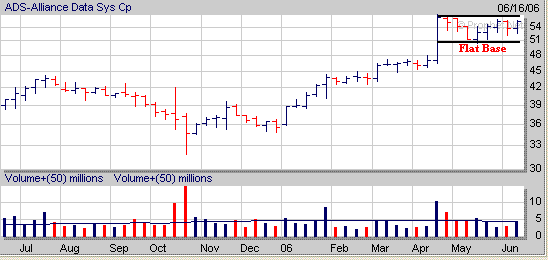
Finally if the market can follow through to the upside over the next few weeks
focus on those stocks which have the best looking chart patterns for potential
opportunities. As mentioned last weekend ADS from our current Stocks to
Watch List has been trading sideways over the past 8 weeks while developing a
Flat Base pattern and has been holding up well during the recent correction.
Signup today for a "Free"
2 Week Trial Membership to Amateur Investors and have access to
all of the Stocks in our current Stocks to Watch Buy List which contains stocks that are currently developing a favorable chart
pattern such as the Cup and Handle, Double Bottom and Flat Base which can be used with either our Long Term
Investing Strategy or Short Term Investing
Strategy.
Also you will have access to these other investment products.
Daily Breakout Reports
Market Timing Indicator
Daily ETF Buy and Short Signals
Click
Here to Signup for a "Free" 2 Week Trial Membership
Send this Free Newsletter to a Friend or Relative
Amateur Investors
|


