|
Click
Here to save 50% on Premium Membership to amateur-investor.net
and have access to our Stocks to Watch List and Daily Breakout Reports
Weekend Stock Market Analysis
(6/18/05)
The action in the Nasdaq over the next two weeks is going to
give us a clue as to whether we are nearing a top or whether the rally
from the April lows is going to continue. The Nasdaq once again has run
into strong upside resistance around 2100 which is the fourth time since last
February. If the Nasdaq is able to break solidly above the 2100 level then
I would expect it to rally up to its previous high near 2190 that occurred early
January. Meanwhile if the Nasdaq stalls out near 2100 and is unable to
break through this resistance area then look for a possible sell off with the
Nasdaq dropping back to the 2040 to 2060 range which corresponds to its 20 Day
EMA (blue line) and 50 Day EMA (green line). 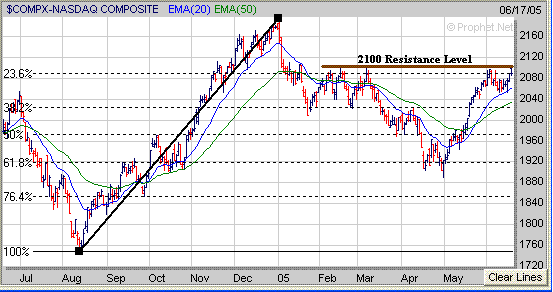
As mentioned in
previous discussions there are two sectors (Biotechs and Semiconductors) that
I'm watching which could give the Nasdaq a boost either to the upside or
downside. First looking at the Biotech (BTK) sector it appears the BTK is
attempting to break out of its longer term Symmetrical Triangle pattern as its
upward and downward sloping trend lines (brown lines) have converged. If
the BTK can break above 560 then I would expect it to rise up to its longer term
61.8% Retracement Level (calculated from the 2000 high to the 2002 low) near 600
(point A) which should have a positive impact on the Nasdaq. Meanwhile if
the BTK fails to get above 560 and eventually drops below its longer term upward
sloping trend line near 500 then that would likely have a negative affect on the
Nasdaq in the longer term. 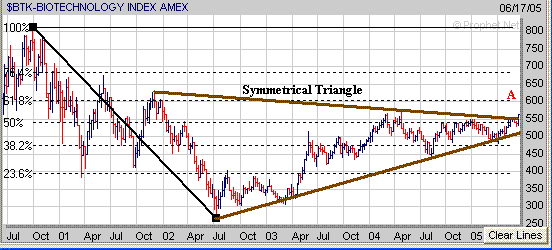
The second sector
to watch is the Semiconductors as the Semiconductor Holders (SMH) are still
exhibiting a potential Double Bottom pattern and are beginning to develop a
small two Week Handle (H). Now in order for the SMH"s to be
constructive they should remain at or above their 40 Weekly EMA (green line)
near 33 while developing a Handle. If the SMH's can hold support above 33
and then eventually break above the 35 level then I would look for a rally up to
the 37 to 39 range which corresponds to their longer term 50% and 61.8%
Retracement Levels (calculated from the January 2004 high to the September 2004
low). If this scenario occurs then the Nasdaq would likely rally back to
its previous early January 2005 high near 2190. Meanwhile if the
SMH's fail to hold support near 33 while developing a Handle then I would expect
them to eventually retest their prior April low near 30 which would likely have
a negative affect on the Nasdaq in the longer term. Thus it will be
interesting to see what transpires in the Biotechs and the Semiconductors over
the next week or two. 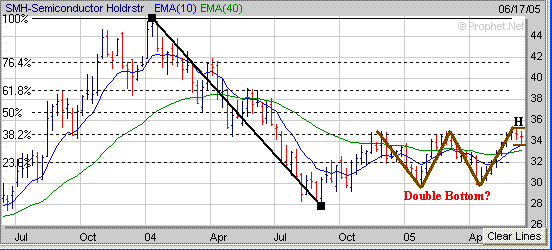
As for the other two
major averages the Dow broke out of its three week trading range (TR) on Friday
however it does have an upside resistance area just below 10700 (point B) which
corresponds to its 23.6% Resistance Level (calculated from the October 2004 low
to the early March high). If the Dow can break above 10700 then it looks
like the next area of resistance would be around 10850 which is where it stalled
out at in late December (point C). Meanwhile if the Dow stalls out near
10700 and comes under some selling pressure I would look for initial support at
its 38.2% Retracement Level near 10500. 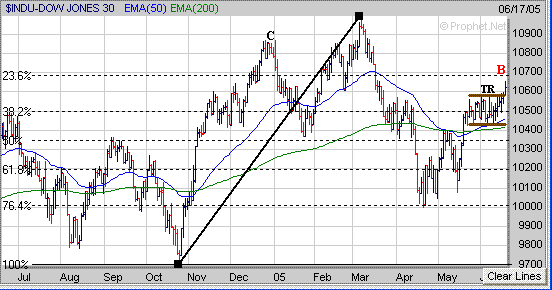
As I
have mentioned in the past the price of Crude Oil has had an impact on the Dow
over the past year or so. Right now the price of Crude Oil is approaching
its previous high made in early April near $60. If the price of Crude Oil
breaks strongly above the $60 level in the weeks ahead then we could see a
repeat of what occurred from mid February through March in which the price of
Crude Oil rose around $10 (points D to E). If this happened then we could
see the price of Crude Oil reach the $70 level which could lead to a potential
sell off in the Dow similar to what occurred during the month of March (points F
to G). However if the price of Crude Oil stalled out near $60 instead and
eventually came under some selling pressure then that might act as a positive
for the Dow. Thus it will be very interesting to watch the price of Crude
Oil over the next few weeks. 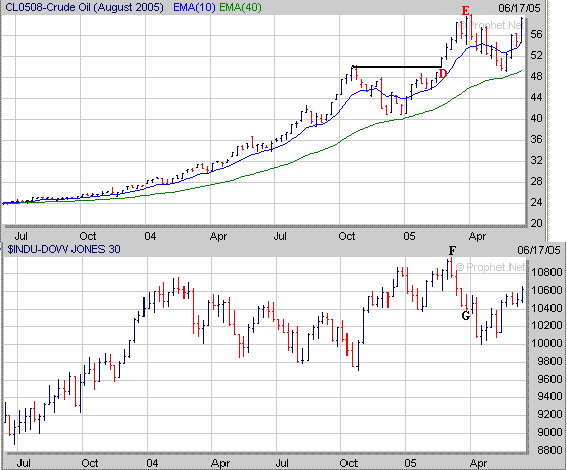
As far as the
S&P 500 it has continued higher and is only about 10 points away from its
early March high near 1229. If the S&P 500 does continue higher in the
near term I would look for resistance to occur near the 1229
level. 
One
thing that still bothers me is the extremely low reading in the Volatility Index
(VIX) as option investors have become very complacent over the past few
weeks. The VIX made a new 52 week intra day low on Friday as it dropped
below 11 (point H). As mentioned before the last three times the VIX has
dropped well below 12 (points I) this has eventually lead to some type of sell
off within a week or two that lasted from 1 to 3 weeks (points J to K) with the
S&P 500 dropping an average of 50 to 60 points. Thus although the
S&P 500 may still rise back to around the 1229 level in the near term I
think we have to be on the lookout for a potential sell off within a week or two
if history repeats itself. 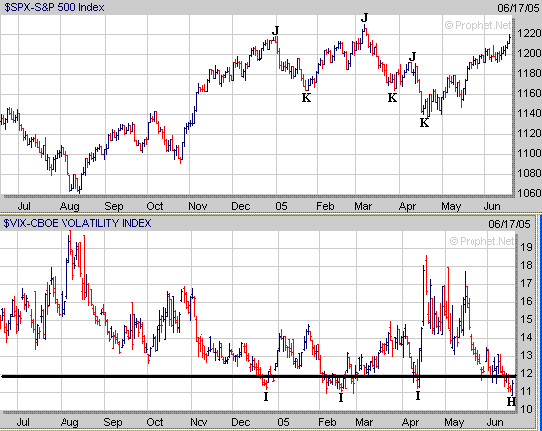
Finally since late April we have
seen several stocks breakout of a favorable chart pattern and move higher.
Those who have read this column on a weekly basis over the past few months were
told to watch GILD in the Biotech sector as it was exhibiting a Cup and Handle
pattern back in May. GILD broke out of its Handle (H) in mid May and has
risen over 10% since then. 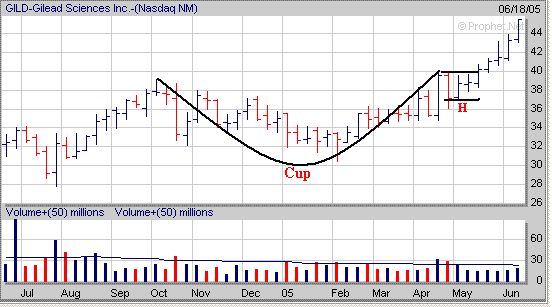
Finally our 50% Off Introductory Special for New Members will
expire at the end of this month. Since going online in late 1999 we have
been providing a list of stocks to buy which focuses on stocks that have decent
Sales and Earnings Growth that are exhibiting a favorable chart pattern such as
the "Cup and Handles", "Double Bottoms" and "Flat
Bases".
Our Performance Statistics versus the Major Averages are
shown below going back to 2000.
(2005 Results are through the month of May)
| Year |
2005 |
2004 |
2003 |
2002 |
2001 |
2000 |
Amateur
Investors |
+16.5% |
+68.8% |
+119.3% |
+48.9% |
+51.3% |
+277.3% |
| Dow |
-2.2% |
+3.1% |
+25.3% |
-16.7% |
-7.1% |
-6.2% |
| Nasdaq |
-4.6% |
+8.6% |
+50.0% |
-31.5% |
-21.0% |
-39.2% |
| S&P 500 |
-1.1% |
+9.0% |
+26.4% |
-23.3% |
-13.0% |
-10.1% |
In addition A Premium Membership to Amateur-Investor.net
allows you to have access to our ETF
Weekly Timing Indicator and Market
Timing Indicator (MTI) as well.
Click
Here to save up to 50% on a Premium Membership
or to signup for a "Free" 2 Week Trial Membership
Amateur-Investor.net
|

