|
Weekend Stock Market Analysis
(6/24/06)
Next week we have a
Federal Reserve meeting and also it will be the end of the 2nd Quarter so I
expect we will see an increase in daily volatility starting next Wednesday which
will continue through Friday.
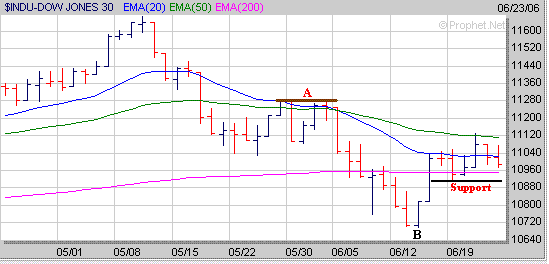
In the near term the Dow has encountered resistance at its 50 Day EMA (green
line) near 11120 but has found support around the 10900 area. Next week I
expect we will see one of two things happen. The first scenario would be
for the Dow to rise above its 50 Day EMA near 11120 leading to an upward move
back to around 11275 (point A) which is where it stalled out at in late May and
earlier this month. Meanwhile the second scenario would be for the Dow to
break below the 10900 level leading to a retest of the low made just a few weeks
ago near 10700 (point B).
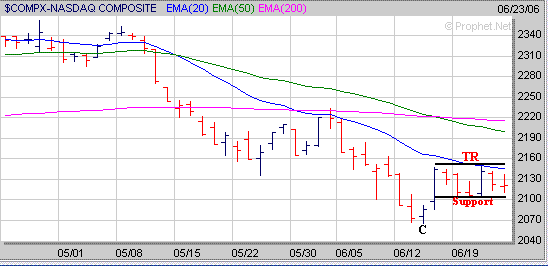
The Nasdaq has been in a short term trading range (TR) after the big move upward
seven trading days ago and has encountered resistance at its 20 day EMA (blue line)
near 2145 while finding support just above the 2100 level. Next week I
would look for one of two things to occur. If the Nasdaq can rise above
the 2145 level then it may quickly rally back to either its 50 Day EMA (green
line) near 2200 or its 200 Day EMA (purple line) just below the 2220
level. Meanwhile if the Nasdaq breaks below the 2100 level the look for it
to retest the low made a few weeks ago near 2065 (point C).
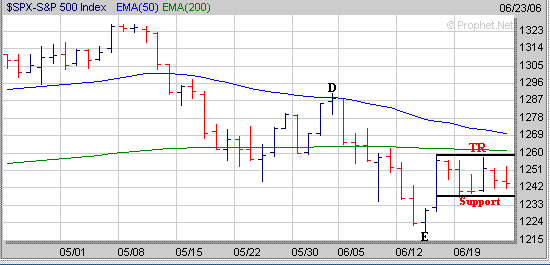
 As for the S&P 500 it has
developed a short term trading range (TR) as well after the big move upward just
over a week ago. In the near term so far the S&P 500 has encountered resistance just
below its 200 day EMA (green line) near 1260 but has been finding support around
1237. I imagine the S&P 500 will break out of this
short term trading range at some point next week and do one of two things.
If the S&P 500 can rise above the 1260 level then look for it to either move
up to its 50 Day EMA (blue line) near 1270 or possibly as high as the 1290 area
which is where it stalled out at in late May (point D). Meanwhile if
the S&P 500 breaks below the 1237 level then look for it to retest its low
made a few weeks ago near the 1220 area (point E).
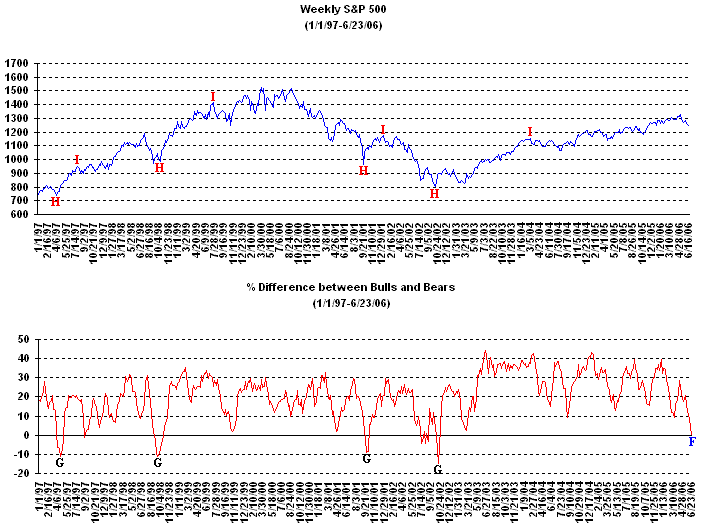
 Although the market hasn't been
acting well since early May there are some encouraging developments that may
eventually bode well for the longer term. The latest sentiment data
involving the % of Bearish and Bullish Investment Advisors now shows that there
is an equal number of Bearish and Bullish Investment Advisors as the % difference has
dropped to zero (point F). If the % of Bearish Investment Advisors
continues to rise and the % of Bullish Investment Advisors continues to fall
then this could eventually signal a nearing market bottom. As we have seen
in the past when the % of Bearish Investment Advisors has outnumbered the % of
Bullish Investment Advisors by around 10% (points G) this has led to a market
bottom followed by a substantial rally (points H to I).
Thus hopefully we will continue to see more Investment Advisors become Bearish
about the longer term prospects of the market which would give us a pretty
reliable signal of a nearing bottom. Although the market has been in a correction since
early May everyone should start making a list of those stocks which have been
holding up the best as they may become the next market leaders once a bottom does
occur. For example BRLI from our Top 100 List is forming the right side of
a 2 1/2 year Cup. 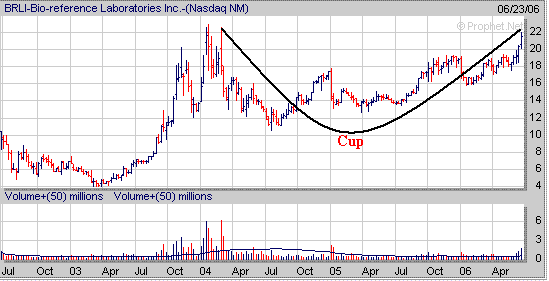 Remember
once a stock has formed a "Cup" it then needs to develop a
constructive "Handle" over a period of weeks to complete a "Cup
and Handle" formation. As an example AKAM formed a 1 1/2 year Cup
followed by a 6 week Handle (H) before breaking out last Winter. AKAM then
doubled in price over the next 6 months after breaking out of its "Cup and
Handle" pattern. 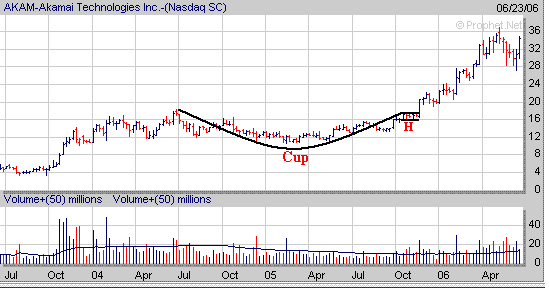
Signup today for a "Free"
2 Week Trial Membership to Amateur Investors and have access to
all of the Stocks in our current Stocks to Watch Buy List which contains stocks that are currently developing a favorable chart
pattern such as the Cup and Handle, Double Bottom and Flat Base which can be used with either our Long Term
Investing Strategy or Short Term Investing
Strategy.
Also you will have access to these other investment products.
Daily Breakout Reports
Market Timing Indicator
Daily ETF Buy and Short Signals
Click
Here to Signup for a "Free" 2 Week Trial Membership
Send this Free Newsletter to a Friend or Relative
Amateur Investors
|


