|
Click
Here to save 50% on Premium Membership to amateur-investor.net
and have access to our Stocks to Watch List and Daily Breakout Reports
(Please note our 50% Off Special for New Members will
end on June 30th)
Weekend Stock Market Analysis
(6/25/05)
Unfortunately the rising price of Crude Oil and the very low
reading in the Volatility Index (VIX) finally took its toll on the market as
strong selling pressure developed on Thursday and carried over into Friday. As
I have mentioned over the past few weeks the VIX had made a new 52 week low
(point A) which wasn't a good sign. The previous two times the VIX had
made a new 52 week low (points B) the S&P 500 eventually came under selling
pressure and dropped around 60 points over the next three weeks (points C to D). 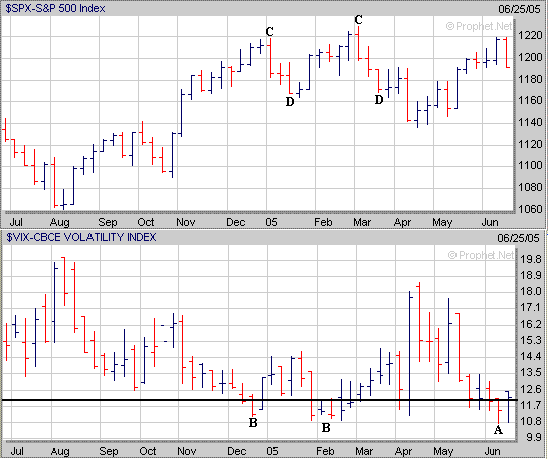
Meanwhile the rising price of Crude
Oil wasn't a good sign either as during the past year the Dow has
eventually come under selling pressure as the price of Crude Oil has continued
higher. The question in my mind is what will the price of Crude Oil do now
as it has rallied back to its previous early April high around $60? If we
see a repeat of what occurred from January through March when the price of Crude
Oil rallied from $40 to $60 (points E to F) after going through a correction in
November and December then we could see another $10 or so rise in the price of Crude Oil which
would take it up the $70 level in the weeks ahead. If this occurs then the
Dow will likely continue under selling pressure like we saw during the month of
March when it dropped around 600 points (points G to H). 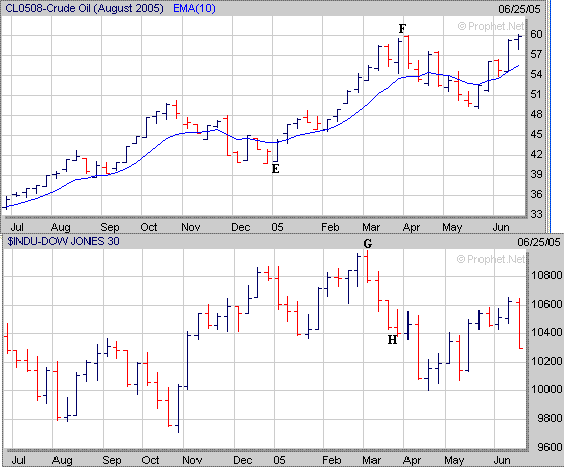
As for the major averages the Nasdaq
was unable to break above its strong upside resistance area near 2100 and came
under selling pressure late in the week. The key support level to watch in
the near term is at its 10 Weekly EMA (blue line) near 2040. If the Nasdaq
fails to hold support near 2040 then its next area of support would be at its 40
Weekly EMA (green line) near 2015. Meanwhile if the Nasdaq does hold
support at or above its 10 Weekly EMA and attempts to rally once again there
will be strong upside resistance near 2100. 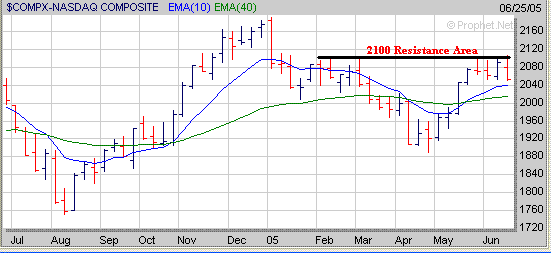
As for the Dow it's now exhibiting a
potential bearish looking Head and Shoulders Top pattern and has broke below its
40 Weekly EMA (blue line) near 10400. As talked about above if the price
of Crude Oil continues higher and makes a run toward the $70 level then the Dow
may eventually drop back to its mid April low near 10000 (point I).
Meanwhile if the Dow attempts to bounce next week I would look for resistance to
occur at its 40 Weekly EMA near 10400. 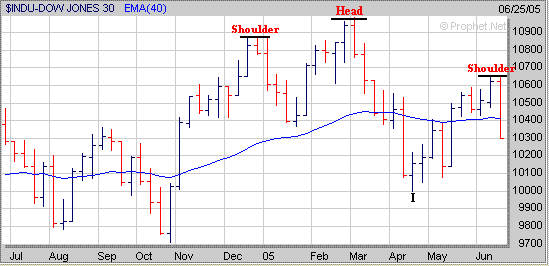
The S&P 500 is also exhibiting a
potential Head and Shoulders Top pattern and has dropped back to its 10
Weekly EMA (blue line) near 1190. If the S&P 500 is unable to hold
support near 1190 then its next area of support would be at its 40 Weekly EMA
near 1170. Meanwhile if the S&P 500 does hold support near 1190 and
attempts to rally I would look for resistance to occur at its Shoulder near
1220. 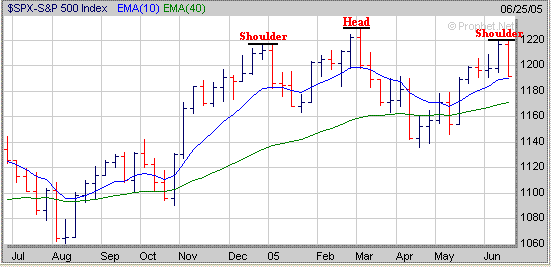
Finally our 50% Off Introductory
Special for New Members will expire at the end of this month. If you don't
like to trade individual stocks and focus more on the ETF's such as the DIA's,
QQQQ's, SPY's and SMH's you may find our Weekly ETF Timing Signals beneficial. An
example is shown below using the SPY's. For Short Signals the first thing
I look for is when the solid Red Line rises above 80 and then drops back below
80 which indicates the market has become overbought. Meanwhile the second
thing I look for is when the solid Blue Line also rises above 80 and then drops
back below 80 as well which confirms the Short Signal (points J). As you
can see currently we are getting very close to having a Short Signal in the
SPY's on a Weekly timescale however the solid Blue Line is still hovering above
the 80 level (point K) so we haven't got a confirmation signal just yet. 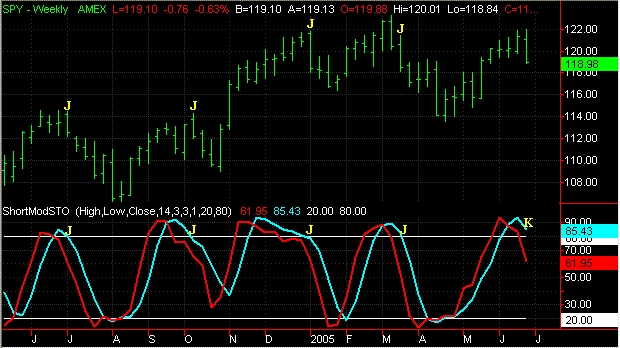
A Premium Membership to Amateur-Investor.net
allows you to have access to our ETF
Weekly Buy and Sell Signals, Market
Timing Indicator (MTI) and Stocks
to Watch List as as well.
Click
Here to save up to 50% on a Premium Membership
or to signup for a "Free" 2 Week Trial Membership
Amateur-Investor.net
|

