|
Signup
today and save 50% on a Premium Membership Plan
which includes our Stocks to Watch List and Daily Breakout Reports
Weekend Stock Market Analysis
(6/26/04)
Expect a volatile week next week as there is a Federal Reserve
Policy meeting and also it will be the end and the 2nd Quarter for the
Institutional Money. The Nasdaq was much stronger last week versus
the Dow and S&P 500 mainly due to the strength in the Semiconductors. The
Semiconductor Holders (SMH) got rather oversold just over a week ago as the %K
Line in association with the Slow Stochastics dropped way below 20 (point A) and
rallied this week. The SMH's stalled out near their 50 Day EMA (blue line)
on Thursday and Friday. The key short term level to watch next week is
around 36.75 (point B). If the SMH's can hold support around 36.75 and rise above their 50 Day EMA then look for the next area of significant upside
resistance near 38.40 which is where their downward sloping trend line (solid
brown line) and 100 Day EMA (green line) reside at. For me to become
bullish on the Semiconductor sector I still think the SMH's must clear the high
made in late May near 39 (point C). Meanwhile if the SMH's fail to
hold support next week near 36.75 look for them to rollover quickly and drop
back to the 35.75 level (point D). 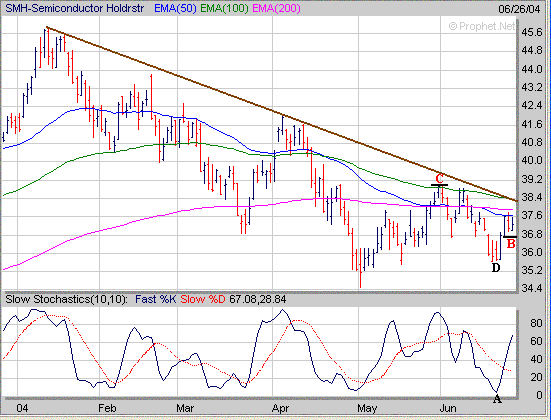
Depending on what the Semiconductors
do will likely influence the technology laden Nasdaq. The Nasdaq has now broken above its downward sloping trend line (solid brown line). If the
Semiconductors can continue to rally look for the Nasdaq to either rise up to the
2055 (point E) or 2080 (point F) levels. Meanwhile if the Semiconductors
come under some selling pressure and the Nasdaq reverses look for initial
support around 1980 which is where its 50 Day EMA (blue line) and 100 Day EMA
(green line) reside at. If the Nasdaq drops below 1980 the next key
support area would be around 1960 (point G) which is where it has held support
three separate times during the month of June. 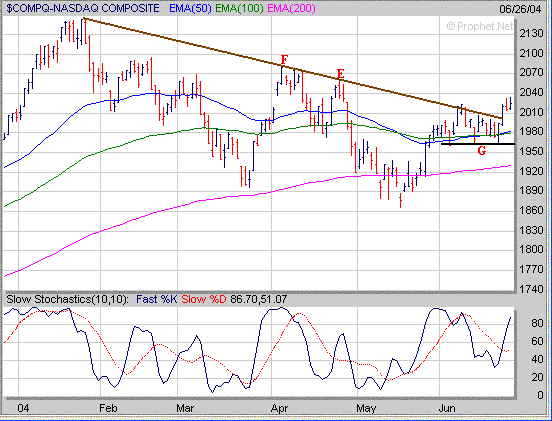
The S&P 500 which
tried to break out of its prior 10 day trading range (TR) reversed strongly to
the downside on Friday probably in response to weakness in the Banking
sector. If additional selling pressure occurs next week in the S&P 500
look for support in the 1118 to 1123 range which coincides with its 50 Day EMA
(blue line) and 100 Day EMA (green line). Meanwhile if the S&P 500
reverses and can break above the 1145 level then look for a rise back to the
March high near 1160 (point H). 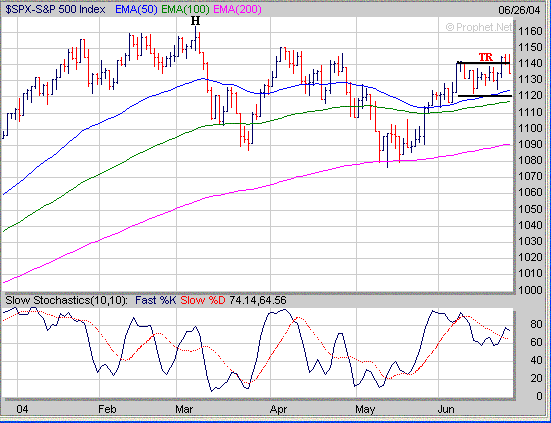
As mentioned above the Banking
sector (BKX) is heavily weighted in the S&P 500 and depending on how the
Banks act next week will likely have a significant impact on the S&P
500. The Federal Reserve meeting will also come into play next week as
well and it will be interesting to see how the BKX reacts to any rate
increase. There are two possible scenario's for the BKX next week as it
has been in a trading range (TR) over the past two weeks. Either the BKX
will break above the 98.25 area which will have a positive impact on the S&P
500 or it will drop below 96 and retest its 200 Day EMA (purple line) around 95
which will have a negative impact on the S&P 500. Like I said above
the outcome of the Federal Reserve meeting may allow for the BKX to breakout of
its trading range strongly in one direction or the other. 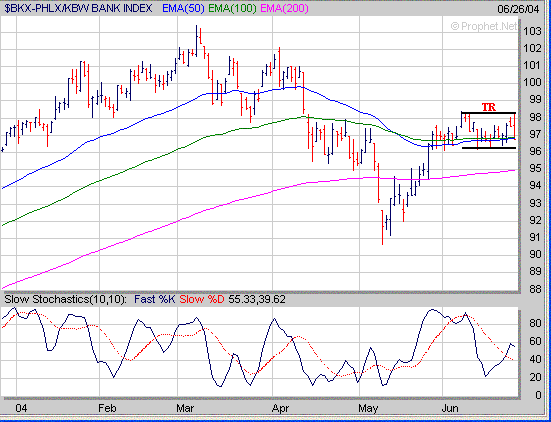
Another thing I have been watching
is the Volatility Index (VIX) of the S&P 500 and have been monitoring two
trends. First during the past 6 months when the VIX has dropped to 14 or
below this has eventually led to selling pressure in the S&P 500 (points
I). This past week the VIX dropped below 14 on Wednesday (point J). The
second thing that I'm seeing is the divergence developing between the
VIX and its %K Line in association with the Slow Stochastics. In April we
saw the same type of pattern develop in which the VIX trended lower (point K) as
the %K Line began to trend higher (point L) which eventually led to a strong
upward move in the VIX and a strong downward move in the S&P 500
(points I to M). Thus is the VIX getting close to making a significant
upward moving like occurred in late April which could lead to additional selling
pressure in the S&P 500? 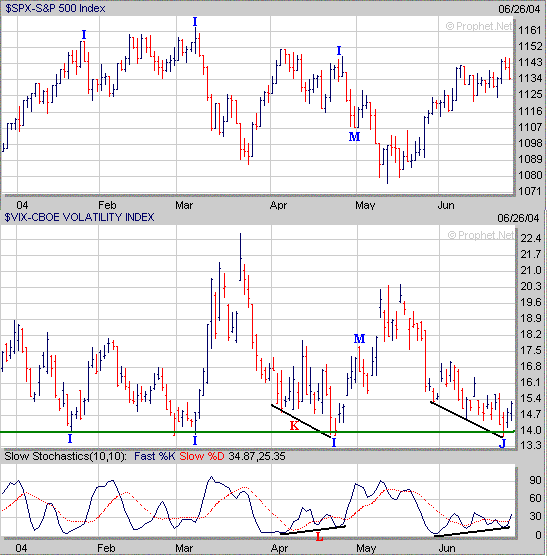
The Dow tried to break out of its 10
day trading range (TR) this week but also reversed strongly to the downside on
Friday. If additional selling pressure occurs in the Dow next week the key
support area to watch is in the 10260 to 10300 range which coincides with its
100 Day EMA (green line) and 50 Day EMA (blue line). If the Dow drops
below 10260 that could spell trouble with an eventual retest of its 200 Day EMA
(purple line) near 10080. Meanwhile if the Dow reverses itself and can
break above 10480 then I would look for upside resistance at its April high near
10575 (point N). 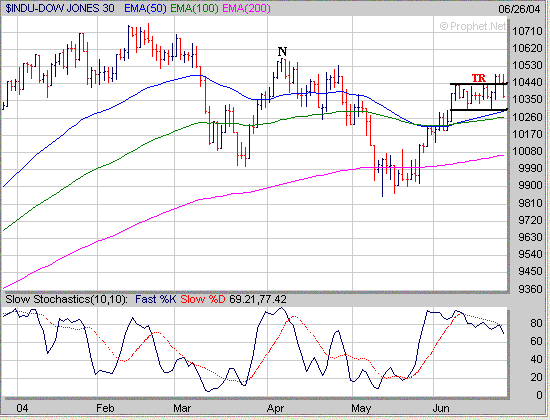
As mentioned in the beginning next
week is going to be very interesting and may get rather volatile especially from
Wednesday on due to the Federal Reserve meeting and the end of the 2nd Quarter
for the Institutional Money. How can a Premium Membership to amateur-investor.net
benefit you as an investor? We focus on stocks which are exhibiting
favorable Sales and Earnings Growth that have developed a favorable chart pattern such as a
"Cup and Handle",
"Double Bottom", "Flat Base" or "Symmetrical
Triangle". These stocks are then
included in our "Stocks to Watch List" which gives investors a
quick reference to those stocks which may provide the best buying opportunities
to the long side in the weeks ahead. Each stock in
our "Stocks to Watch List"
includes specific Buy Prices, Stop Loss Prices (very important) and projected
Target Prices.
Signup
Today for a "Free" 30 Day Trial Membership
and see which Stocks to Buy or Short in the weeks ahead
Amateur-Investor.net
|


