|
Click
Here to save 50% on Premium Membership to amateur-investor.net
and have access to our Stocks to Watch List and Daily Breakout Reports
Weekend Stock Market Analysis
(6/4/05)
As we mentioned last weekend the low reading in the Volatility
Index (VIX) was somewhat concerning. Although most of the week the market didn't
come under selling pressure that changed on Friday. As shown below the
last three times the VIX has dropped below a reading of 12 (points A) this has
been eventually followed by some selling pressure which lasted from 1 to 3 weeks
(points B to C). If this pattern repeats itself then we might expect to
see some selling pressure redevelop which could last from 1 to 3 weeks possibly. 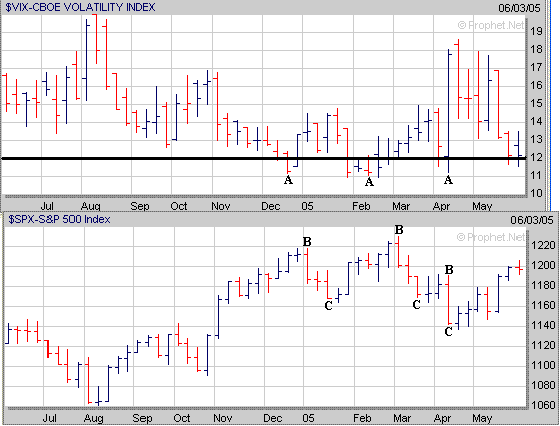
Meanwhile as mentioned in the Mid Week Analysis the price of
Crude Oil has now risen well above its 50 Day EMA (blue line). The
question at this point is will a similar pattern develop like occurred in the
early part of the year when Crude Oil made a bottom (point D), and then
eventually rallied to new highs (points D to E), and will this have an adverse
affect on the market? The last time the price of Crude Oil began to
rally strongly after making a bottom was in January (points D to F) which led to a sell off in the Dow
(points G to H). Thus this will be something to watch over the next few weeks. 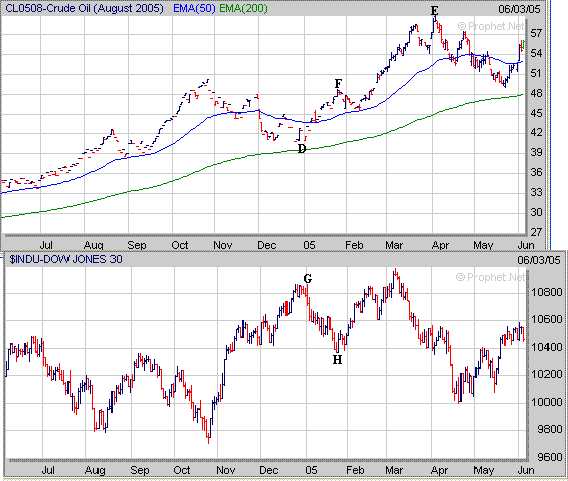
As for the major averages it appears the Nasdaq has
encountered strong upside resistance once again near the 2100 area which is
where it stalled out at last February and March (points I). At this point
it looks like we may see a pullback develop in the Nasdaq. If the Nasdaq
does undergo a pullback I would look for initial support in the 2025 to 2040
range which is where its 20 Day EMA (blue line) and 38.2% Retracement Level
(calculated from the August 2004 low to the early January high) come into
play at. Meanwhile in the longer term if the Nasdaq can hold support in the 2025 to 2040
range and eventually break above the 2100 resistance zone then its next major
upside resistance area would be at its early January high near 2190 (point
J). 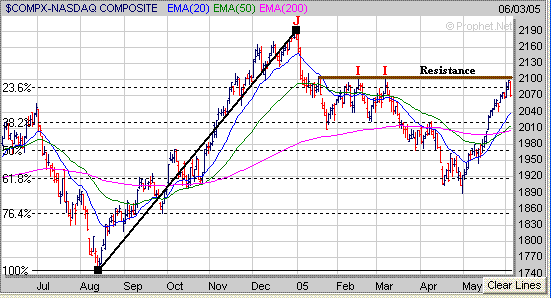
As for the Dow it really hasn't gone anywhere over the past
week or so and has pretty much been going sideways. If the Dow continues to move sideways or drops some look
for initial support near 10400 which is at its 200 Day EMA (green line).
If the Dow fails to hold support near 10400 then it may find support at its 50%
Retracement Level (calculated from the October 2004 low to the early March high)
around 10350. Meanwhile if the Dow holds support near 10400 and attempts to rally it still has an upside
resistance area just below 10700 which corresponds to its 23.6% Retracement
Level. 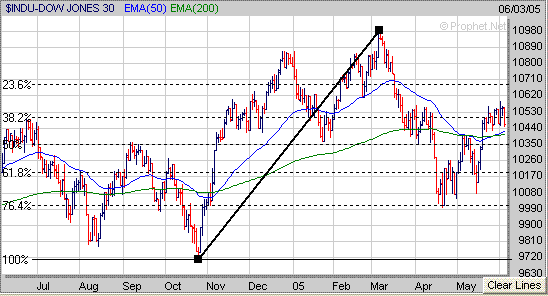
The
S&P 500 so far has been able to stay above its 23.6% Retracement Level
(calculated from the August 2004 low to the early March high) near 1190.
If the S&P 500 comes under some selling pressure next week and drops below
1190 then its next area of support would be at its 50 Day EMA (blue line) near
1180. Meanwhile if the S&P 500 can hold support near 1190 and then
resumes its upward trend it may encounter upside resistance in the 1210 to 1215
range. 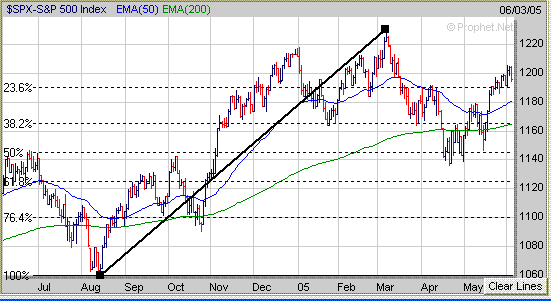
If
the major averages do begin to pullback some over the next few weeks start developing a list of stocks
which are forming a favorable chart pattern. AIR from our Top 100
List is forming the right side of a 1 1/2 Year Cup and will eventually need to
develop a Handle to complete a "Cup and Handle" pattern. 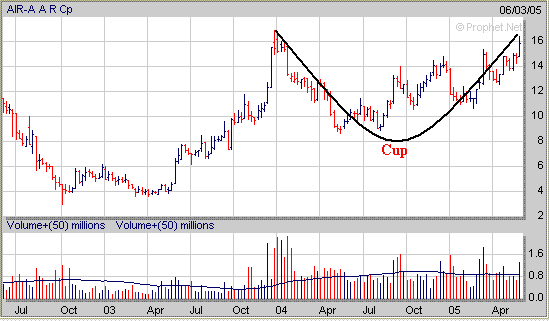
Finally our 50% Off Introductory Special for New Members will
expire at the end of this month. Since going online in late 1999 we have
been providing a list of stocks to buy which focuses on stocks that have decent
Sales and Earnings Growth that are exhibiting a favorable chart pattern such as
the "Cup and Handles", "Double Bottoms" and "Flat
Bases".
Our Performance Statistics versus the Major Averages are
shown below going back to 2000.
(2005 Results are only through the month of May)
| Year |
2005 |
2004 |
2003 |
2002 |
2001 |
2000 |
Amateur
Investors |
+16.5% |
+68.8% |
+119.3% |
+48.9% |
+51.3% |
+277.3% |
| Dow |
-2.2% |
+3.1% |
+25.3% |
-16.7% |
-7.1% |
-6.2% |
| Nasdaq |
-4.6% |
+8.6% |
+50.0% |
-31.5% |
-21.0% |
-39.2% |
| S&P 500 |
-1.1% |
+9.0% |
+26.4% |
-23.3% |
-13.0% |
-10.1% |
In addition A Premium Membership to Amateur-Investor.net
allows you to have access to our ETF
Weekly Timing Indicator and Market
Timing Indicator (MTI) as well.
Click
Here to save up to 50% on a Premium Membership
or to signup for a "Free" 2 Week Trial Membership
Amateur-Investor.net
|


