|
Click
Here to Signup for a Free 2 Week Trial Membership and
have access to our Stocks to Watch List and Daily Breakout Reports
Weekend Stock Market Analysis
(3/12/05)
The Dow and S&P 500 are nearing important support levels in
the near term. The Dow has a key short term support level around 10700
which coincides with its 50 Day EMA (blue line) and upward sloping trend line
(black line) originating from the late October 2004 low. As long as the
Dow can hold support near 10700 its longer term up trend will remain
intact. However if the Dow does break below its upward sloping trend line
that could signal a change in longer term direction for the Dow so watch the
10700 area closely next week. 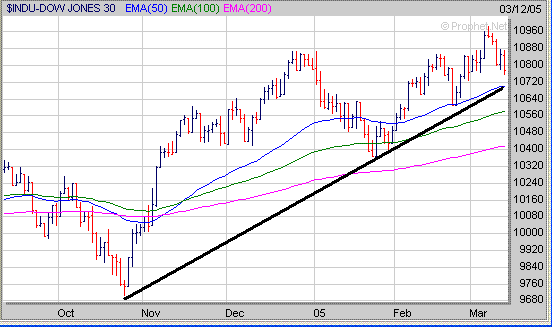
As
far as the S&P 500 it's already near a key short term support level around
1197 which coincides with its 50 Day EMA (blue line) and upward sloping trend
line (black line) originating from its late October 2004 low. If the
S&P 500 fails to hold support near 1197 next week then its next area of
support would be at its 100 Day EMA (green line) near 1180. Meanwhile if
the S&P 500 does hold support near 1197 and then begins to rally look for
resistance at its previous high near 1228 (point A). 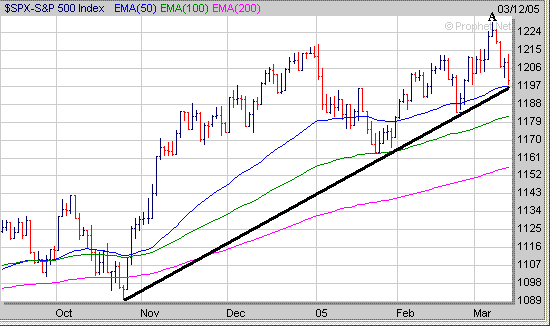 A key sector to watch that will have
an impact on future direction in the S&P 500 is the Banks. The
Banking Index (BKX) has dropped back below its 200 Day EMA (green line) and is
approaching its upward sloping trend line (black line) originating from the May
2004 low. If the BKX breaks solidly below the 98 level this wouldn't be a
good sign and could lead to an eventual drop back to its late October low near
95 which would have a negative impact on the S&P 500 as well. Thus it
will be important next week for the BKX to hold support near 98. 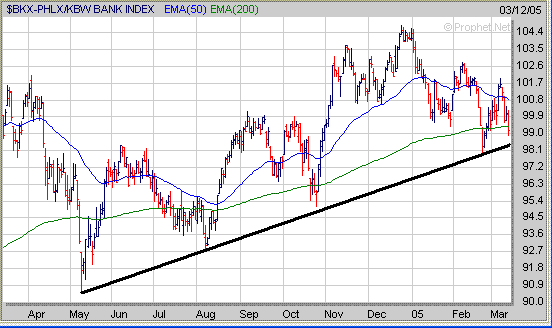
The
Nasdaq is still struggling and has been basically stuck in a trading range since
late January between 2010 (support) and 2110 (resistance). If the Nasdaq
continues under selling pressure look for support around 2010 which coincides
with its 200 Day EMA (blue line) and late January low. If this support
level doesn't hold then the Nasdaq's next area of support would be around 1970
(point B) which is at its 50% Retracement Level (calculated from the August low
to the early January high). 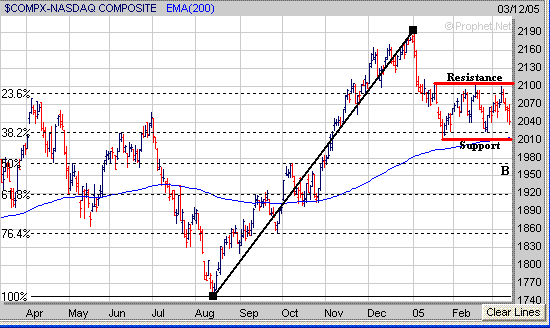
A sector to watch that will continue
to have an impact on the Nasdaq is the Semiconductors. So far the
Semiconductor Holders (SMH) have been encountering strong resistance near 35
since November of 2004. In the near term the SMH's so far have been able
to hold support near 33 which is close to their 50 Day EMA (blue line) and 200
Day EMA (green line). If the SMH's fail to hold support near 33 this could
lead to an eventual retest of their late January low near 30 (point C) which
would have a negative impact on the Nasdaq. Meanwhile in order for the Nasdaq
to make a strong upward move in the future the SMH's will likely have
to break strongly above the 35 area. 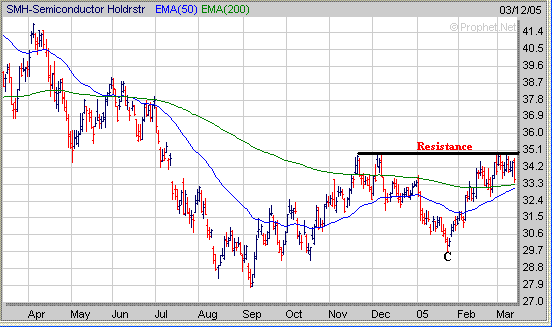
Finally as I have talked about
before sometimes when you miss an initial breakout in a stock they will give you
a second opportunity especially if they are in a strong performing sector.
A recent example was MWP which is in the Oil sector. Notice that it made a
nice move from September through October and gained nearly $6 (points D to
E). MWP then began to trade sideways in November and December and
developed a 9 week Flat Base (FB) which we had begun noticing in December.
MWP then broke out of its Flat Base in early January as the Oil
sector rallied and gained another $6 over the next 6 weeks. 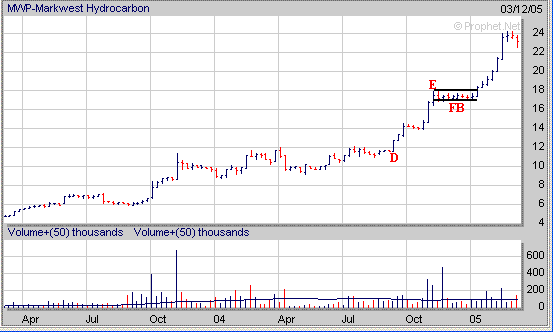
Signup today for a 2
Week Trial Membership and have access to our Stocks
to Watch List which provides a list of Stocks that are exhibiting a
favorable Chart Pattern such as the "Cup and Handle", "Double
Bottom" and "Flat Base". Also you
will receive our Daily Breakout Report
by email which Alerts you to Stocks that
are breaking out of a favorable Chart Pattern from our Stocks
to Watch List.
Click
Here to signup for a "Free" 2 Week Trial Membership
Amateur-Investor.net
|

