|
Signup
today and save 50% on a Premium Membership Plan
which includes our Stocks to Watch List and Daily Breakout Reports
Weekend Stock Market Analysis
(3/13/04)
The trading ranges that the major averages were exhibiting since
mid January ended this week as they all broke to the downside accompanied by
increasing volume. Although there was a a large reversal day on Friday due
to the market being very oversold the downside breakout in the major averages
out of their previous trading ranges is troublesome. Meanwhile
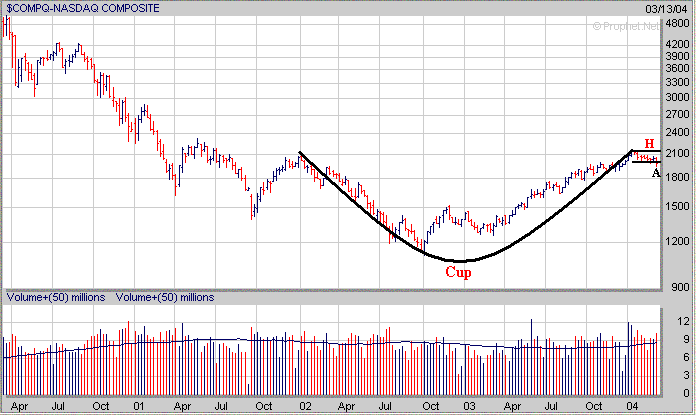
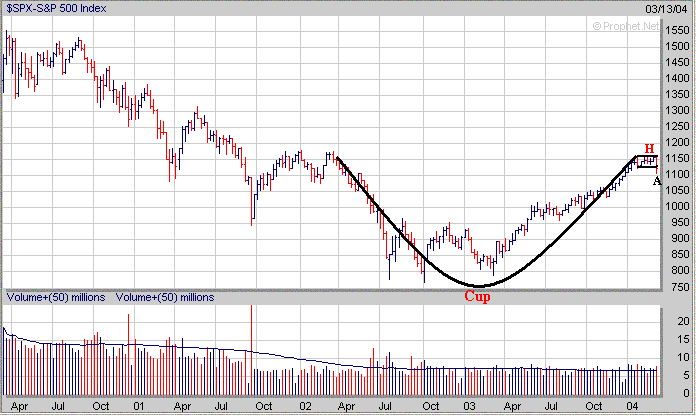
the favorable "Cup and Handle" patterns that were developing appear to
be breaking down as all three major averages failed to hold support at the
bottom of their Handles (points A) this past week. 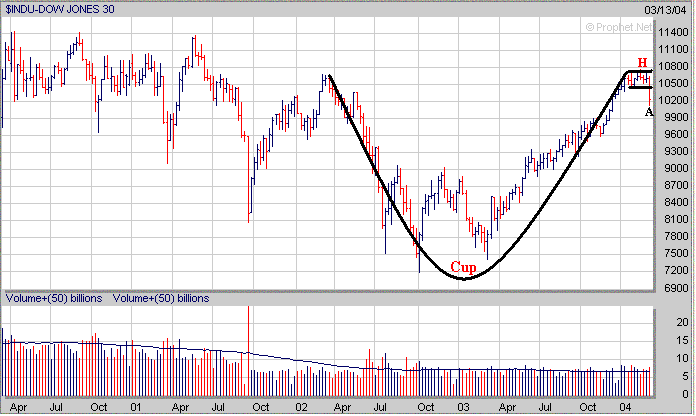
Although it appears the market could
be breaking down there is still the possibility that all we are seeing is a
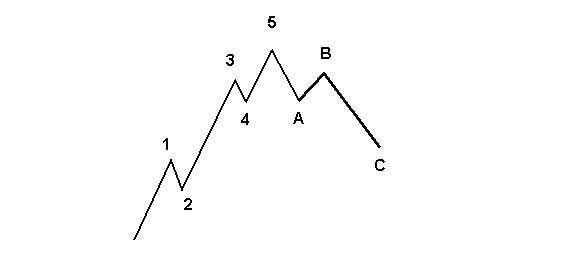
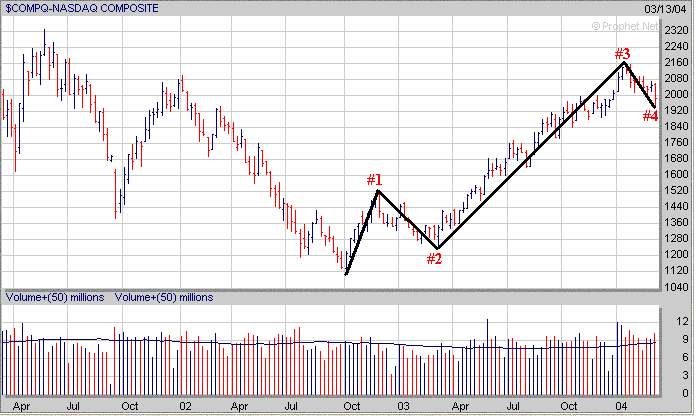
corrective 4th Wave for those that follow Elliot Wave Theory. Without
getting to technical a brief example of a what an Elliot 5 Wave Pattern looks
like is shown below.
Notice how Waves 1,3 and 5 are upward moves with Wave 3 lasting
the longest while Wave 5 is the shortest. Meanwhile also notice that Waves
2 and 4 are corrective Waves which only last for a brief period of time before
the upward trend continues.
If we look at the Nasdaq it appears to be still exhibiting a
corrective 4th Wave. Thus the question still remains is this corrective
4th Wave setting the stage for a final upward 5th Wave as shown by the chart
above or is this the beginning of a more serious correction to the downside?
As far as the shorter term the Dow briefly broke below its 20
Weekly EMA (green line) but closed near it on Friday. If we see some
follow through to the upside next week I would look for resistance in the 10400
to 10450 area which is back near the bottom of the Dow's prior trading range and
10 Weekly EMA (blue line). Meanwhile if the Dow fails to rally next week
and comes under more selling pressure the next support area to the downside
would be in the 9850 to 9900 area which corresponds to its 40 Weekly EMA (purple
line) and 23.6% Retracement Level calculated from the October 2002 low to the
January 2004 high. 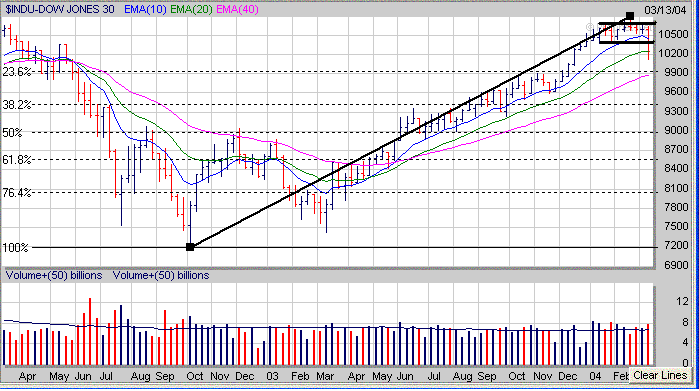
The
Nasdaq broke below its 20 Weekly EMA (green line) this past week but closed near
it on Friday. If the Nasdaq fails to rally next week and comes under more
selling pressure the next area of downside support is in the 1890 to 1910 range
which coincides with its 40 Weekly EMA (purple line) and 23.6% Retracement Level
calculated from the October 2002 low to the January 2004 high. 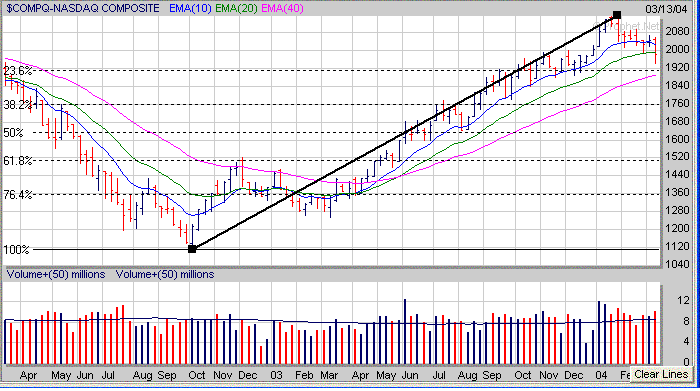
Meanwhile
if we take a closer look at the Nasdaq it has been exhibiting a downward channel
since late January and has been making a series of lower highs (points B) and
lower lows (points C). If the Nasdaq does rally in the near term from
oversold conditions I would look for resistance in the 2030 to 2040 range which
coincides with its 50 Day EMA (blue line) and downward sloping trend line from
the January high. 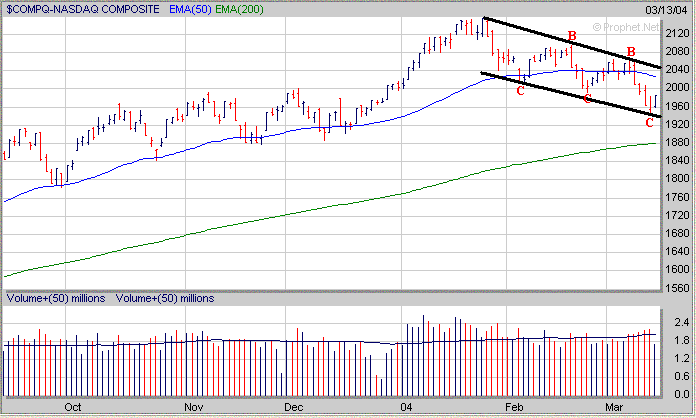
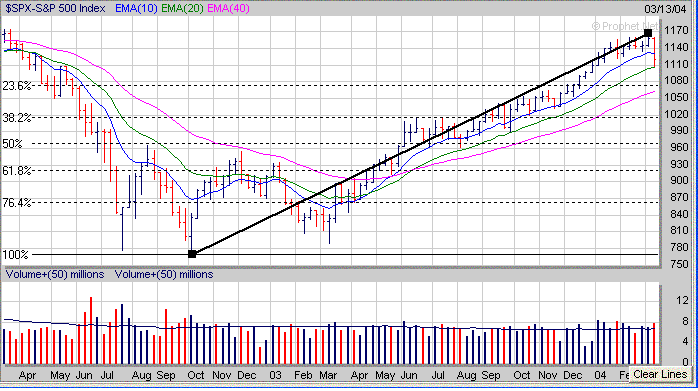
As far as the S&P 500 it found support this past week at its
20 Weekly EMA (green line) near 1105. If the S&P 500 does rally from
oversold conditions next week I would look for resistance in the 1130 to 1140
area. Meanwhile if the S&P 500 comes under more selling pressure the
next area of support to the downside would be in the 1065 to 1075 range which
coincides with its 40 Weekly EMA (green line) and 23.6% Retracement Level
calculated from the October 2002 low to the early 2004 high.
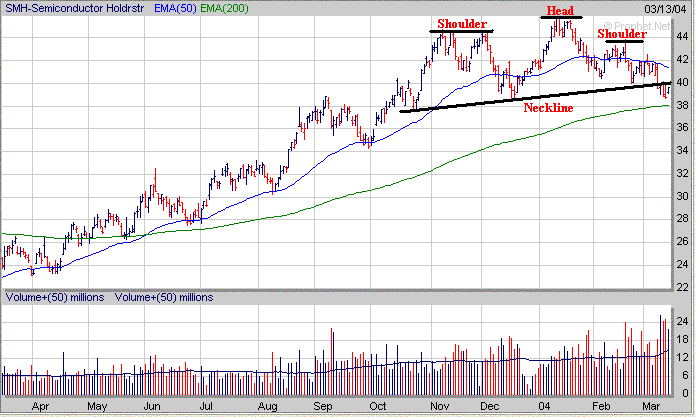
Meanwhile
looking at the Semiconductor sector the Semiconductor Holders (SMH) are still
exhibiting a Head and Shoulders Top pattern and are just below their
Neckline. If the SMH's can break above their Neckline near 40 then I would
look for resistance at their 50 Day EMA (blue line) near 41.50 in the near
term. Meanwhile the SMH's still have a critical support area around 38
which is at their 200 Day EMA (green line). The SMH's must hold support at
their 200 Day EMA to prevent a much larger drop which would likely affect the
rest of the market as well.
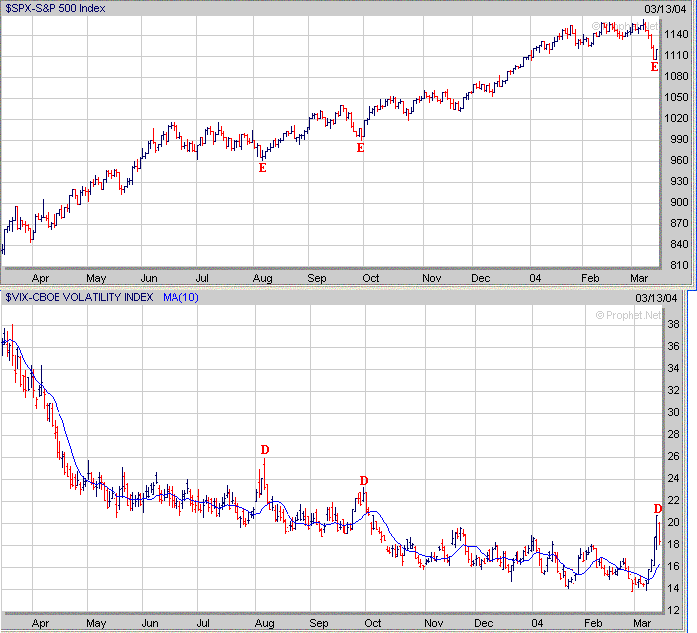
For those of you that receive my Daily Breakout Reports know
that I mentioned Thursday night that the market was probably due for a strong
bounce. This was due to the fact that the Volatility Index (VIX) had
become stretched significantly away from its 10 Day Moving Average while the Put
to Call Ratio had risen well above 1.0. As you can see below when
the VIX has become stretched away from its 10 Day Moving Average (points D) this
has led to some type of reversal in the S&P 500 (points E).
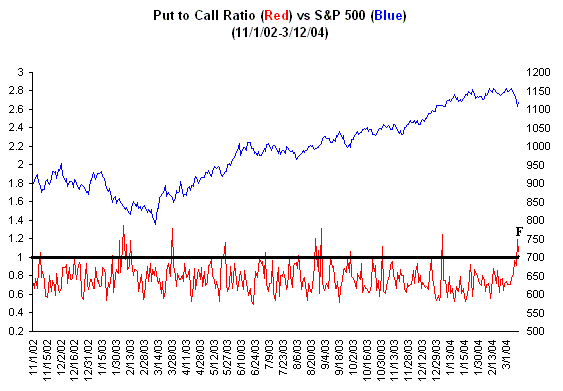
In addition the Put to Call Ratio rose significantly above 1.0
(point F) which was an indication that a market reversal was nearing.
A lot of you have asked me what you
should look for when deciding which stocks to short if playing both sides of the
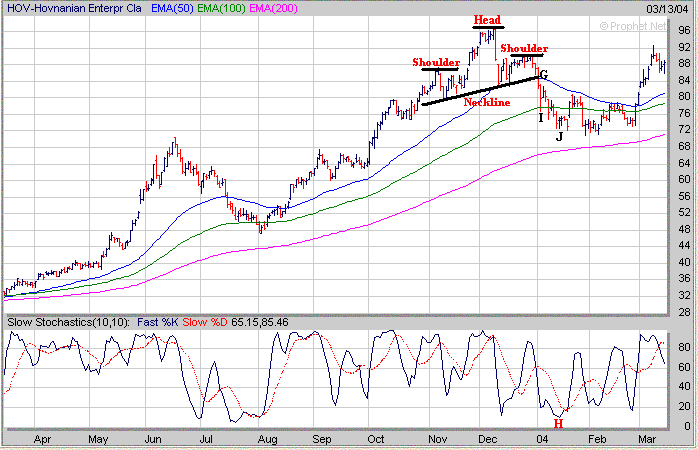
market. One chart pattern to look for is the Head and Shoulders Top
pattern. HOV provides a fairly good example of a stock which formed a Head
and Shoulders Top pattern after becoming overbought based on the Stochastics.
In this example the best time to have shorted HOV would have been as it broke
below its 50 Day EMA (blue line) and Neckline which were in the $84 area (point
G). Once you have initiated a short you have to make two decisions.
First you have to figure out where to place a Stop Loss Order in case the stock
reverses to the upside instead. In the case of HOV I would have placed my
Stop Loss near the 2nd Shoulder which was around $90. Meanwhile the second
decision you have to make is where to take profits as the stock continues
lower. In most cases I look at Exponential Moving Averages (EMA) in
combination with the Stochastics. In the example with HOV my first target
price to the downside would have been at its 100 Day EMA (green line) near $77
with my second target price near its 200 Day EMA (purple line) around $67.
However when I look at the Stochastics and see the %K line drop below a reading of 20 that is usually an
indication too me to cover my position regardless of whether it has reached my
target prices or not. In the case of HOV you can see it quickly dropped
back to its 100 Day EMA but never reached its 200 Day EMA as the %K line dropped
below 20 (point H). Thus in this situation I would have covered half
of my initial short position at the 100 Day EMA near $77 (point I) and then sold
the rest near $72 (point J) as the %K line dropped below
20. 
How can a Premium Membership to amateur-investor.net
benefit you as an investor? We focus on stocks which are exhibiting
favorable Sales and Earnings Growth that have developed a favorable chart pattern such as a "Cup and Handle",
"Double Bottom", "Flat Base" or "Symmetrical
Triangle". These stocks are then
included in our "Stocks to Watch List" which gives investors a
quick reference to those stocks which may provide the best buying opportunities
to the long side in the weeks ahead. Each stock in
our "Stocks to Watch List"
includes specific Buy Prices, Stop Loss Prices (very important) and projected
Target Prices. In addition we also maintain a list of Stocks
which may provide shorting opportunities as well as shown by the example of HOV
above. Signup
Today for a "Free" Trial Membership
and see which Stocks to Buy or Short in the weeks ahead
Amateur-Investor.net
|


