|
Click
Here to Signup for a Free 2 Week Trial Membership and
have access to our Stocks to Watch List and Daily Breakout Reports
Weekend Stock Market Analysis
(3/19/05)
The rising price of Crude Oil finally took its toll on the Dow
as they have been trending in opposite directions over the past year.
Generally when the price of Crude Oil has risen (points A to B) the Dow has come
under selling pressure (points C to D) and when the price of Crude Oil has
dropped (points B to A) the Dow has risen (points D to C). If this trend
continues over the next several weeks then the performance of the Dow will
likely depend on what the price of Crude Oil does. 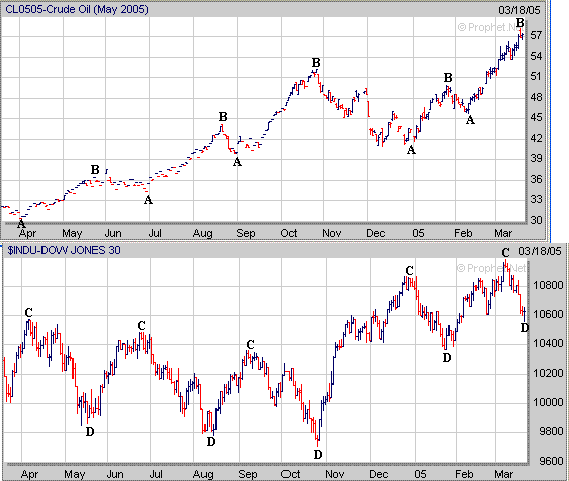
As far as the major averages the Dow
has dropped below its 50 Day EMA (blue line) around 10700 but still remains
above its 200 Day EMA (purple line) near 10440. In the near term the Dow
has become somewhat oversold on a daily basis and we may see a brief oversold
bounce occur sometime next week. If this bounce does occur I would look
for resistance to occur in the 10700 (50 Day EMA) to 10750 range (20 Day EMA).
Meanwhile if a bounce doesn't develop and the Dow continues lower its next
support area would be in the 10440 to 10375 range which corresponds to its 200
Day EMA and the low made in late January (point E). 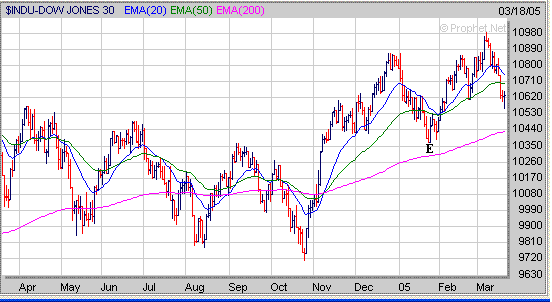
The Nasdaq broke below its 200 Day
EMA (purple line) and previous January low near 2010 last week and really needs
to hold support near 2000. Just like the Dow the Nasdaq has become
somewhat oversold in the near term and if a bounce occurs I would look for
resistance to occur at its 20 Day EMA (blue line) just above 2040.
Meanwhile if the Nasdaq continues lower instead we have to look at Retracement
Levels (calculated from the August low to the early January high) to determine
where the next levels of downside support may exist. The 50% Retracement
Level is around 1970 (point F) and the 61.8% Retracement Level is at 1920 (point
G) so those are two possible levels the Nasdaq could find support at if it
continues lower. 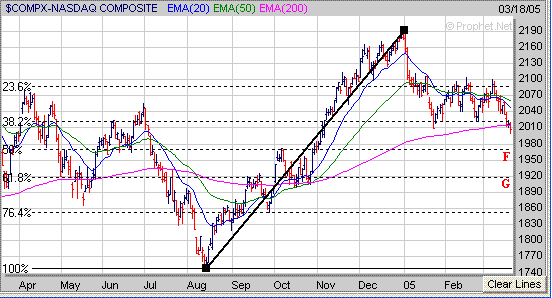
As far as the S&P 500 it has
broken below its 50 Day EMA (green line) near 1197 but still remains above its
200 Day EMA (purple line) near 1160. If a brief bounce develops from
oversold conditions look for possible resistance to occur near 1200 which is at
the S&P 500's 20 Day EMA (blue line). Meanwhile if the S&P 500
doesn't bounce and continues lower its next level of support would be at its 200
Day EMA (purple line) near 1160 which also corresponds to its longer term upward
sloping trend line (black line) originating from the August low. 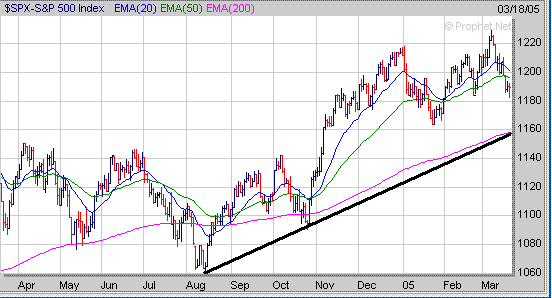
As
I have talked about before the Banks are a sector to watch as they will have an
impact on the S&P 500. Despite the S&P 500 making new highs
in early March the Banking Index (BKX) is exhibiting a potentially bearish
looking pattern as it appears to be developing a downward trending channel
(brown lines) after it peaked in late December. If the BKX continues stuck
in this downward trending channel then this could pose problems for the S&P
500 in the longer term. 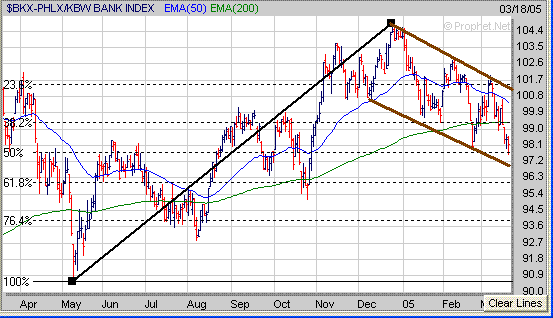
Meanwhile
although I haven't talked about the market psychology for a while this week I
thought I would comment on the Bullish-Bearish Investment Advisor
Sentiment. The chart below compares the S&P 500 to the % Difference
between the Bullish and Bearish Investment Advisors going back to the late
1990's. As you can see major market bottoms have occurred when the %
Difference between the two has dropped well below zero which indicates the % of
Bullish Investment Advisors is less than the % of Bearish Investment
Advisors. Since 1997 there have been four times (points H) when the % of
Bullish Investment Advisors has been significantly lower than the % of Bearish
Investment Advisors such that the % difference has reached -10% or lower.
The last time we saw the % difference drop to -10% was in October of 2002 which
preceded the strong rally that developed in the S&P 500. From the time
the S&P 500 bottomed in late 2002 near 790 to when it reached around 1230 in
early March of this year it had gained over 50% which is quite a
run. Thus although it doesn't happen
often when the % of Bullish Investment Advisors is significantly less than the %
of Bearish Investment Advisors there is a very good chance the market is getting
close to a major bottom which will be followed by a significant rally. 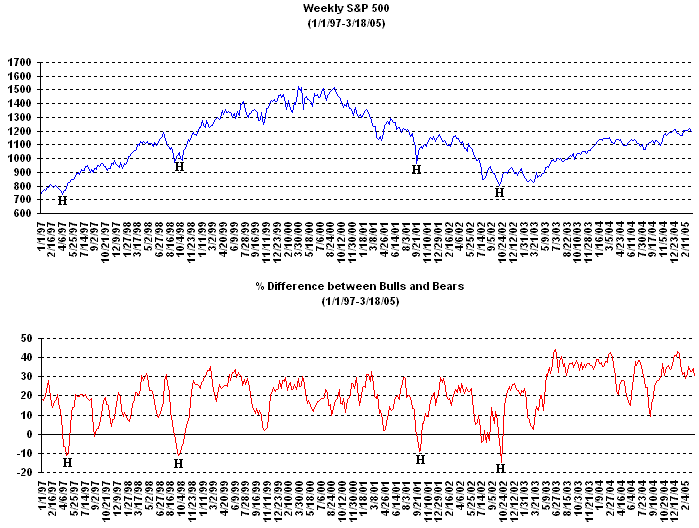
Signup today for a 2
Week Trial Membership and have access to our Stocks
to Watch List which provides a list of Stocks that are exhibiting a
favorable Chart Pattern such as the "Cup and Handle", "Double
Bottom" and "Flat Base". Also you
will receive our Daily Breakout Report
by email which Alerts you to Stocks that
are breaking out of a favorable Chart Pattern from our Stocks
to Watch List.
Click
Here to signup for a "Free" 2 Week Trial Membership
Amateur-Investor.net
|


