|
Signup
today and save 50% on a Premium Membership Plan
which includes our Stocks to Watch List and Daily Breakout Reports
Weekend Stock Market Analysis
(3/20/04)
The key short term support level to watch next week in the Dow
is around 10100 (point A). If this level is taken out then the next
area of support for the Dow is in the 9850 to 9900 area. The 9850 level is
the Dow's 200 Day EMA (purple line) while the 9900 level is at the Dow's 23.6%
Retracement (point B) calculated from the October 2002 low to the high made in
January. Meanwhile if the Dow can find short term support near 10100 and
tries to mount a rally look for resistance at its 50 Day EMA (blue
line) near 10400. 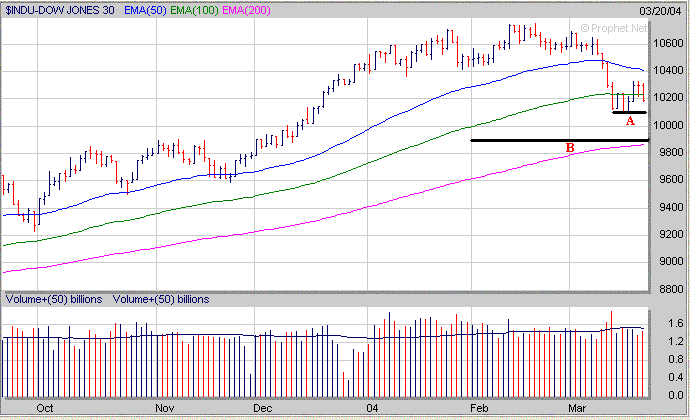
The Nasdaq has been making a series
of lower highs (H) and lower lows (L) since peaking in January. The key
short term support area to watch is around 1925 (point C). If the 1925
level is taken out the next support area to the downside in the Nasdaq would be
near its 200 Day EMA (purple line) around 1880. Meanwhile if the Nasdaq
can hold support near 1925 and tries to rally look for initial resistance at its
100 Day EMA near 1980. 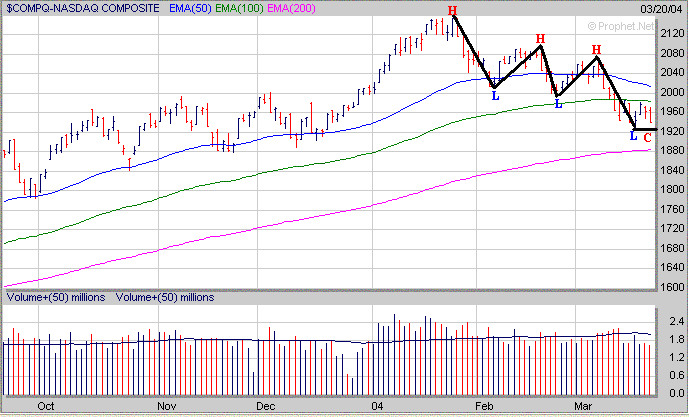
The S&P 500 has been stuck in a
trading range over the past 5 trading days between its 50 Day EMA (blue line)
and 100 Day EMA (green line). Eventually it's probably going to break one
way or the other before much longer. Either the S&P 500 will rise
above its 50 Day EMA near 1125 and make a run up to its previous high near 1160
or it will break below its 100 Day EMA near 1105 and drop back to the 1060-1070
area. The 1060 level near its 200 Day EMA (purple line) while the 1070
area (point D) is the S&P 500's 23.6% Retracement Level calculated from the October 2002 low
to the early March high. 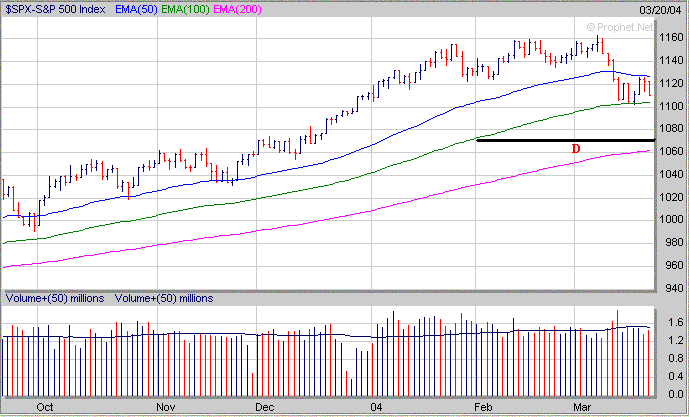
Meanwhile the Semiconductor sector
continues to breakdown as the Semiconductor Holders (SMH) have pierced both
their 200 Day EMA and Neckline in association with a Head and Shoulders Top
pattern. It's critical that the SMH's find support near the 38 level next
week. If the SMH's don't then look for their next area of downside support
at their 38.2% Retracement Level (calculated from the October 2002 low to the
January high) near 35. Suffice to say if the SMH's fail to hold support
near 38 and continue to breakdown the rest of the market will likely follow as
well. 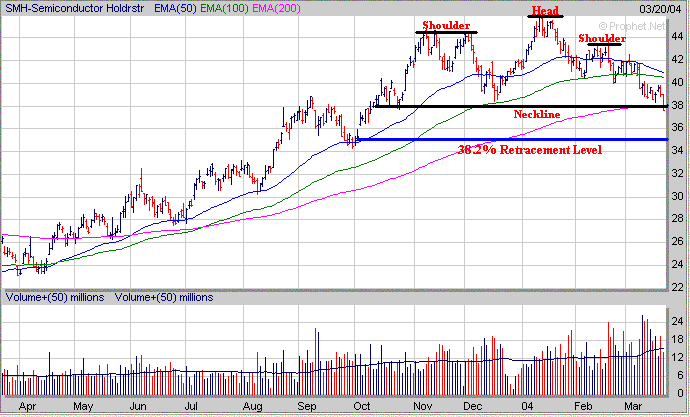
For those of you following the Gold
and Silver sector (XAU) it looks like the XAU is beginning to stabillize with a
key support area near 93. In the longer term the XAU still appears to have
formed a Cup and is now beginning to develop a Handle (H). If the XAU can
eventually break above its longer term resistance area near 114 (which coincides
with its 61.8% Retracement calculated from the 1996 high to the 2000 low) then
it would probably rally up to its longer term 76.4% Retracement Level near 128
(point E). 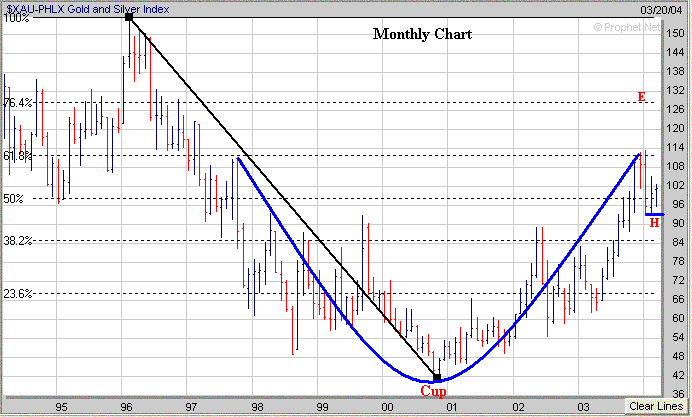
Another sector that
looks interesting is the Oil Service sector as the Oil Service Holders (OIH)
appear to have formed the right side of a 2 year Cup. What I would look
for now is the development of a constructive Handle over the next few weeks
while holding support near the 69 level. 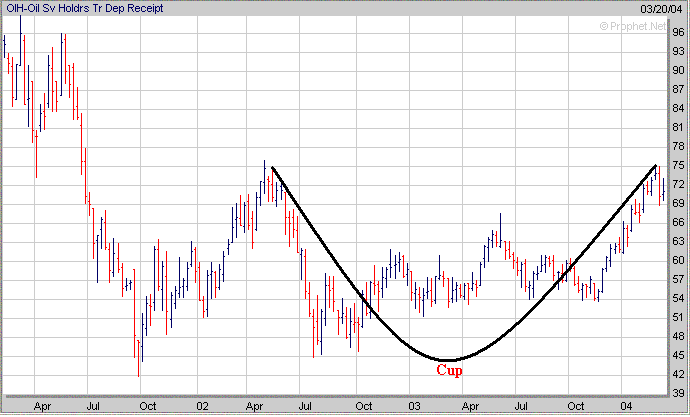
Finally when the market is in a
correction phase most stocks are going to follow the trend of the market which
can provide shorting opportunities. Although shorting stocks is more
difficult to learn it can allow investors to play both sides of the market which
can increase your profits. Let's look at one possible opportunity
if the market continues to trend lower. NTES had a strong thrust downward
over the past few weeks but has been wedging higher over the past 4 trading days
on diminishing volume and is encountering resistance near its 50 Day EMA (blue
line). In addition NTES has developed a small Symmetric Triangle pattern
which is usually a signal that a substantial move is nearing. In this
example my entry point on NTES would be just below its 100 Day EMA (green line)
near $47 to play a potential move to the downside. My initial target price
would be around the $43 level which is at the 200 Day EMA (green line).
Now you also have to be prepared to get out of NTES if it breaks to the upside
instead from its Symmetrical Triangle pattern. In this example my
protective Stop Loss Order would be set just above the 50 Day EMA near $49 or
so. 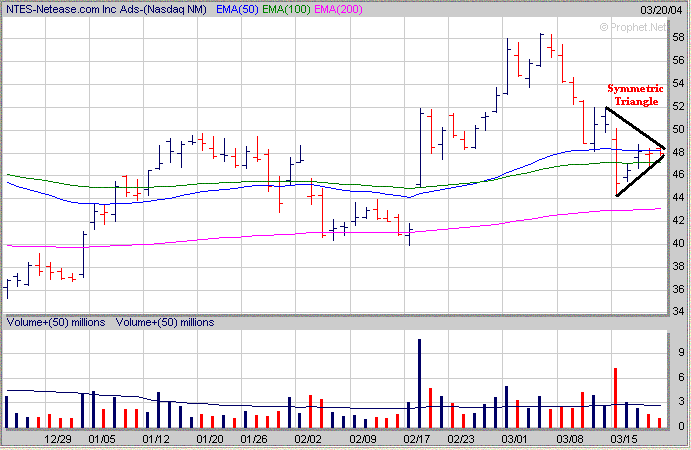
How can a Premium Membership to amateur-investor.net
benefit you as an investor? We focus on stocks which are exhibiting
favorable Sales and Earnings Growth that have developed a favorable chart pattern such as a "Cup and Handle",
"Double Bottom", "Flat Base" or "Symmetrical
Triangle". These stocks are then
included in our "Stocks to Watch List" which gives investors a
quick reference to those stocks which may provide the best buying opportunities
to the long side in the weeks ahead. Each stock in
our "Stocks to Watch List"
includes specific Buy Prices, Stop Loss Prices (very important) and projected
Target Prices. In addition we also maintain a list of Stocks
which may provide shorting opportunities as well as shown by the example of NTES
above. Signup
Today for a "Free" Trial Membership
and see which Stocks to Buy or Short in the weeks ahead
Amateur-Investor.net
|


