|
Weekend Stock Market Analysis
(3/25/06)
A longer term chart of the Nasdaq shows each time it has moved
higher the past three years (points A to B) a pullback has occurred (points B
to A) before it eventually moved higher again. As we have seen the past
few months the Nasdaq has been basically stuck in a trading range (TR) between
2233 and 2333 after making a 300 point upward move from October of last year
through the early part of January this year. Thus instead of seeing a
sharp pullback like has occurred in the past (points B to A) the Nasdaq has developed a consolidation pattern the past several
weeks. Of course the question is when and in which direction will the
Nasdaq break out of this trading range? 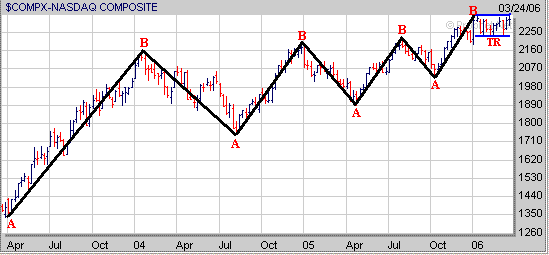
I still believe the key to which
direction the Nasdaq will break out of its trading range will depend on what the
Semiconductor sector does in the the weeks ahead. The Semiconductor Index
(SOX) rallied from September of 2004 through the early part of this year (points
C to D) but ran into strong upside resistance near 560 which is where it stalled
out at in early 2004 (point E) and has been in a pullback mode the past eight
weeks. So far the SOX has held support above its 40 Weekly EMA (blue line)
just above the 480 level which is also where its 38.2% Retracement Level (solid
brown line) calculated from the September 2004 low to the early January 2006
high resides at as well. If the SOX can hold support above the 480 level
and then begin to rally strongly this may allow for the Nasdaq to break out of its
trading range to the upside. However if the SOX were to break below the
480 level then this could lead to a significant move lower possibly back to the
420 level (point F) which would likely have a negative impact on the Nasdaq in
the longer term. Thus continue to watch the SOX closely over the next few
weeks. 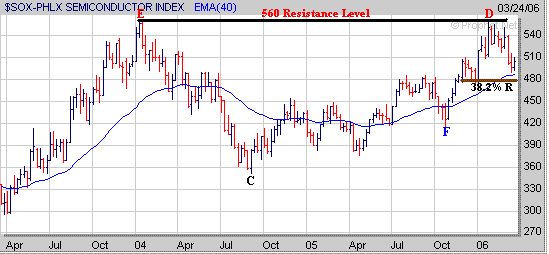
Meanwhile as far as the Dow and
S&P 500 further upside movement in both of them will likely depend on
whether the Nasdaq can break out of its trading range to the upside or not in
the weeks ahead. The Dow is nearing a longer term upside
resistance area in the 10350 to 10400 range which is where it encountered
resistance at back in 2000 and 2001 after rallying from oversold
conditions. If the Nasdaq were able to break out of its trading range
strongly to the upside then this may allow for the Dow to rise above the 10400
level and rally back to its all time high made in early 2000 near 11700 (point
G). However keep in mind if the Nasdaq is unable to break out of its
trading range then the Dow will likely have a difficult time breaking above the
10400 level. 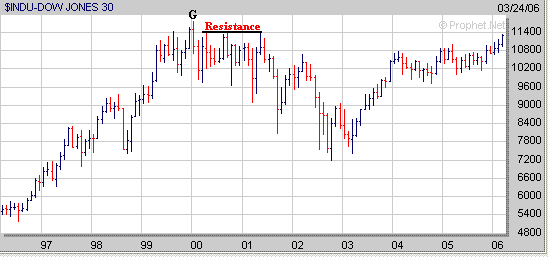
As far as the S&P 500 it still
has some longer term resistance near 1315 which is where it stalled out at in
May of 2001 (point H) after bouncing from oversold conditions. As
mentioned above if the Nasdaq were to break strongly to the upside out of its
trading range then this may allow for the S&P 500 to rise up to the 1360
level which corresponds to its longer term 76.4% Retracement Level (point I)
calculated from the early 2000 high to the low made in October of 2002.
However if the Nasdaq is unable to break out of its trading range to the upside
then the S&P 500 may have a difficult time rising above the 1315 level. 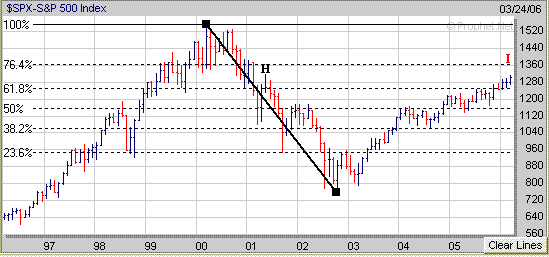
Meanwhile for those following the
price of Crude Oil it has been developing a trading range (TR) the past five
weeks while holding support near its 40 Weekly EMA (blue line). I would
expect at some point the price of Crude Oil will do one of two things in the
weeks ahead which may affect the major averages. First if the price of
Crude Oil were to break below below the bottom of its trading range near the 61
level then I would expect it to drop back to around the 58 level which is a
longer term support area which may have a positive affect on the major
averages. Meanwhile the second possibility would be for the price of Crude
Oil to break above the top of its trading range just below the 66 level and then
rally back to its previous high just above the 70 level (point J) which may have
an adverse affect on the major averages in the longer term. 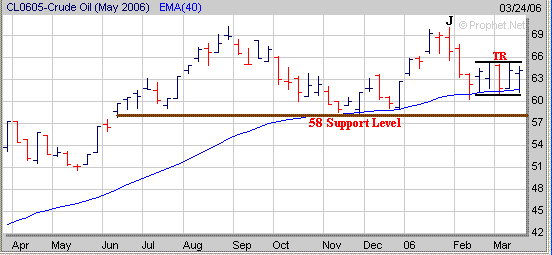
To sum things up if the Nasdaq can
break solidly out of its 2 1/2 month trading range in the weeks ahead then look
for a decent upward move in the Dow and S&P 500 as well. However if
the Nasdaq remains stuck in its trading range then look for more choppiness in
the the other major averages as well. During the past several
weeks there has been an increase in the number of stocks which have developed a favorable chart
pattern as the Nasdaq has been in a consolidation pattern. For example ZRAN
from our current Stocks to Watch List has developed a 7 week Handle (H)
after forming the right side of a longer term Cup. If ZRAN can break out
of its Handle near the $22.50 level then it may rise back to where it stalled
out at in 2003 near the $27 level (point K). 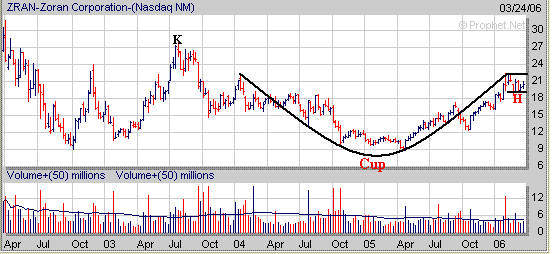
Signup today for a "Free"
2 Week Trial Membership to Amateur Investors and have access to
all of the Stocks in our current Stocks to Watch Buy List which contains stocks that are currently developing a favorable chart
pattern such as the Cup and Handle, Double Bottom and Flat Base which can be used with either our Long Term
Investing Strategy or Short Term Investing
Strategy.
Also you will have access to these other investment products.
Daily Breakout Reports
Market Timing Indicator
Daily ETF Buy and Short Signals
Click
Here to Signup for a "Free" 2 Week Trial Membership
Send this Free Newsletter to a Friend or Relative
Amateur Investors
|


