|
Click
Here to Signup for a Free 2 Week Trial Membership and
have access to our Stocks to Watch List and Daily Breakout Reports
Weekend Stock Market Analysis
(3/26/05)
The major averages remain under selling pressure however I still
expect to see some type of oversold bounce since we are nearing the end of the
month and the 1st Quarter. In addition some possible short covering may
occur as well. The Dow so far has held support at its 200 Day EMA
(purple line) near 10440. If an oversold bounce doesn't occur at its 200
Day EMA then I would expect the Dow to potentially undergo an oversold bounce
once it reaches the 10370 to 10350 range. The 10370 level was the low the
Dow made in late January (point A) while the 10350 level (point B) coincides
with the Dow's 50% Retracement Level (calculated from the late October 2004 low
to the high made in early March). If an oversold bounce does develop look
for upside resistance around 10650 which is where its 20 Day EMA (blue line) and
50 Day EMA (green line) reside at. Meanwhile if the Dow drops below the
10350 level then its next support level would be at its 61.8% Retracement Level
near 10200. 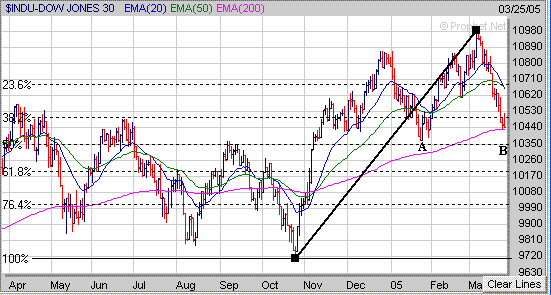
Meanwhile as I have mentioned before
the price of Crude Oil and the Dow have been pretty much going in opposite
directions during the past year or so such that when the price of Crude Oil has
risen (points C to D) the Dow (points E to F) has fallen and when the price of
Crude Oil has dropped (points D to C) the Dow has rallied (points F to E). The
price of Crude Oil did come under some selling pressure this week and I would
look for initial support at its 10 Weekly EMA (blue line) near 52. If the
price of Crude Oil doesn't hold support near 52 then its next support level
would be at its 20 Weekly EMA (green line) near 50. If we continue to see
a drop in the price of Crude Oil in the near term this could help the Dow
stabilize and undergo some type of oversold bounce if the previous pattern that
we have seen over the past year continues. 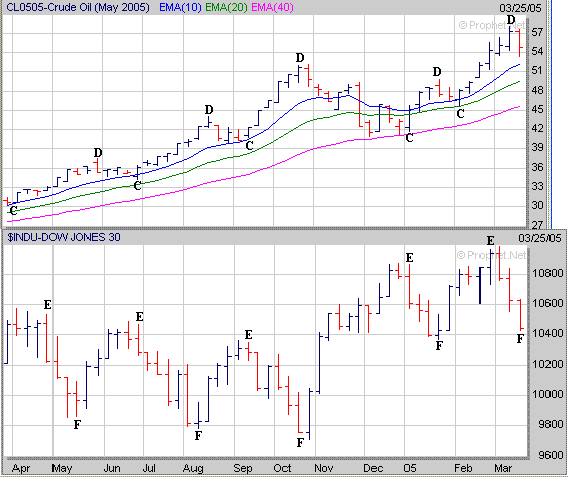
The Nasdaq still remains below its
200 Day EMA (purple line) near 2010 and has a key support level in the near term
around 1970 (point G) which corresponds to its 50% Retracement Level (calculated
from the August 2004 low to the early January high). If the Nasdaq can
hold support at or above the 1970 level and begins to undergo an oversold bounce
look for upside resistance at its 20 Day EMA (blue line) near 2030.
Meanwhile if the Nasdaq doesn't hold support at its 50% Retracement Level and
continues lower its next major support level would be at its 61.8% Retracement
Level around 1920 (point H). 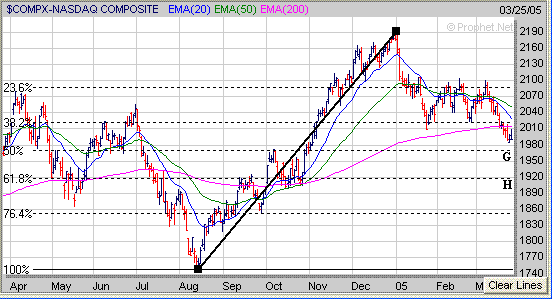
A key sector to watch that will have
an impact on the Nasdaq is the Semiconductors. Right now the Semiconductor
Holders (SMH) are exhibiting a potential "Double Top" pattern and they
have a key support level in the near term at 32. If the SMH's fail to hold support at 32
then look for them to drop back to their January low near 30 (point I) which
would likely have a negative impact on the Nasdaq. 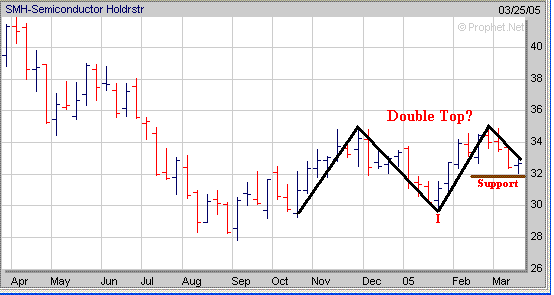
As far as the S&P 500 it still
remains above its late January low near 1163 and its 200 Day EMA (purple line)
near 1160 which are key support levels in the near term. If the
S&P 500 holds support in the 1160 to 1163 range and an oversold bounce
occurs look for upside resistance near 1195 which is where its 20 Day EMA (blue
line) and 50 Day EMA (green line) reside at. Meanwhile if the S&P 500
fails to hold support in the 1160 to 1163 range and continues lower look for the
next area of support at its 50% Retracement Level (calculated from the August
2004 low to its early March high) near 1145 (point J). 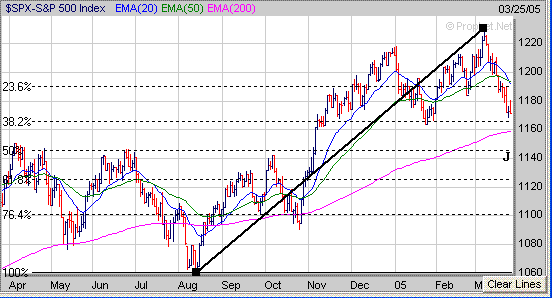
A key sector to watch which will
have an impact on the S&P 500 are the Banks. The Banking Index (BKX)
has broken below its longer term upward sloping trend line (solid black line)
that originated from the May 2004 near 91. If the BKX doesn't hold support
near its October 2004 low near 95 (point K) then look for it to drop back to its
August 2004 low near 93 (point L) or its May 2004 low around 91 (point M) which
would have a negative impact on the S&P 500. 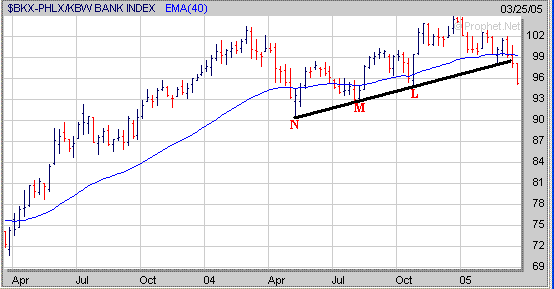
Although it can be frustrating when
the market undergoes a correction it does give you the opportunity to start
finding those stocks which are holding up well and not getting sold off as this
can be a clue to whom the next market leaders will be once the selling
ends. Thus it's important to start noticing which stocks are developing a
favorable chart pattern. Here is a recent stock (LB) in our watch
list that has formed the right side of a 4 month Cup and now has to start
developing a constructive Handle in the weeks ahead to complete a "Cup and
Handle" pattern before moving higher. 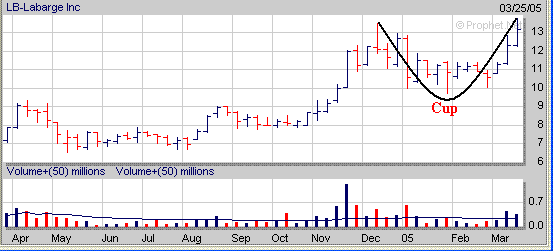
Signup today for a "Free"
2 Week Trial Membership and have access to our Stocks
to Watch List which provides a list of Stocks that are exhibiting a
favorable Chart Pattern such as the "Cup and Handle", "Double
Bottom" and "Flat Base". Also you
will receive our Daily Breakout Report
by email which Alerts you to Stocks that
are breaking out of a favorable Chart Pattern from our Stocks
to Watch List.
Click
Here to signup for a "Free" 2 Week Trial Membership
Amateur-Investor.net
|


