|
Weekend Stock Market Analysis
(3/4/06)
Over the past two weeks the price of Crude Oil has begun to
rally and has risen back above its 50 Day EMA (blue line). As we
have seen in the past there has been an inverse relationship between the price
of Crude Oil and the Dow such that a rise in the price of Oil has usually had a negative
affect on the Dow while a drop in the price of Oil has had the opposite affect.
Notice when the price of Crude Oil peaked in late January and then sold off
through mid February (points A to B) that this led to a decent rally in the Dow
(points C to D). Thus if the price of Crude Oil continues to
rise this could have a negative affect on the market especially if Crude Oil
eventually rallies back to its late January high just above the 70
level. 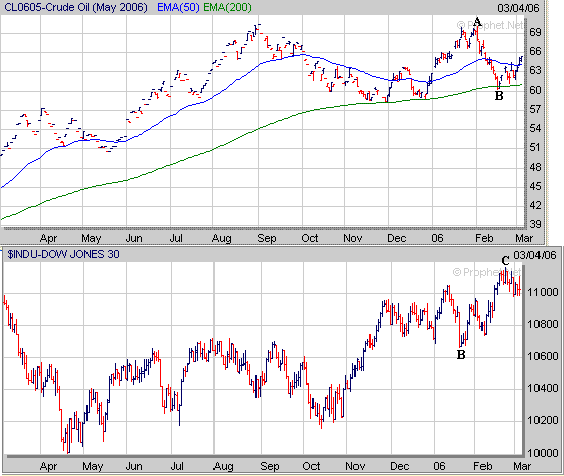 Meanwhile as mentioned last weekend
both the Nasdaq and S&P 500 have been stuck in a trading range since mid
January. The Nasdaq has been encountering upside resistance just above 2330
while finding support just below the 2240 level. 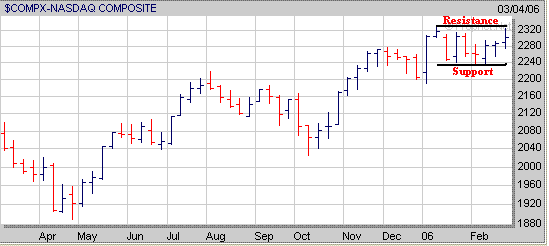
As for the S&P 500 it has been
encountering upside resistance just above 1295 while finding support just below
the 1260 level. At some point I would expect both of these indices to
breakout of these trading ranges leading to a significant move in one direction
or the other. 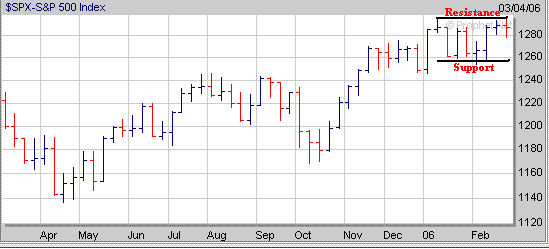
As I have mentioned before the one
sector that could have a significant impact on the Nasdaq is the
Semiconductors. The Semiconductor Index (SOX) has now developed a 5 week
Handle (H) after forming the right side of a 2 year Cup. At some point the
SOX is going to break out of its Handle and make a decent move in one direction
or the other. If the SOX breaks out of its Handle to the upside then this
would have a positive affect on the Nasdaq. Meanwhile if the SOX were to
break out of its Handle to the downside then this would have a negative affect
on the Nasdaq. 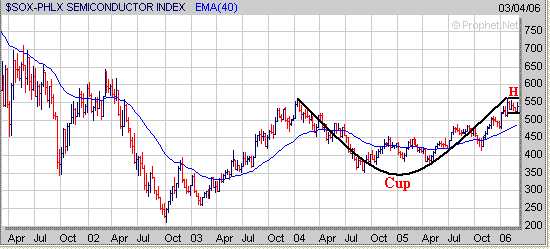
Finally another interesting
development over the last month or so has been the trend among the Bullish
and Bearish Investment Advisors. As you can see from the graph below the %
of Bullish Advisors has begun to drop (point D) while the % of Bearish Advisors
has begun to rise (point E). If this trend continues in the weeks ahead I
would view this as a positive development for the major averages.
Currently the % difference between the Bullish and Bearish Advisors is around
12%. The last time the % difference between the Bullish and Bearish
Advisors dropped below 12% was in the Fall of 2004 when the % difference dropped
to around 10% (point F) which was then followed by a 100 point upward move in
the S&P 500 (points G to H). 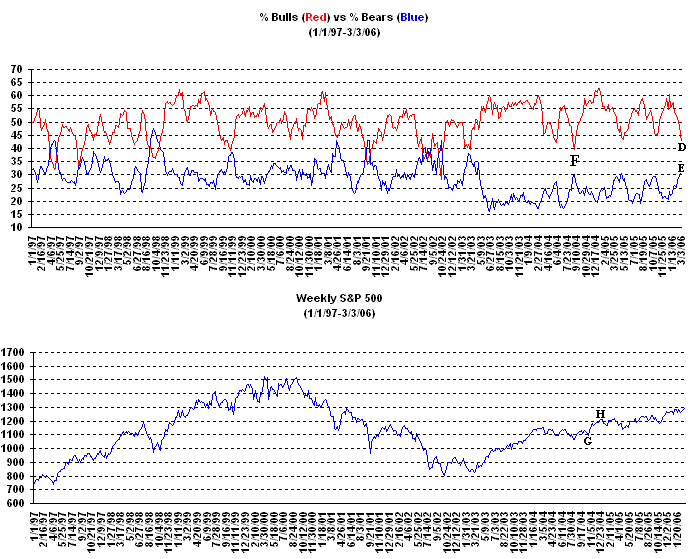 Over the past several weeks I know
many investors have become frustrated with the choppy market conditions
especially in the Nasdaq and S&P 500. However this has allowed for
several stocks to develop a favorable chart pattern. If the Semiconductor
Index (SOX) eventually does break out of its Cup and Handle pattern to the
upside those stocks which are Semiconductor related may provide some leadership. For example KLIC
from our current Stocks to Watch List has developed a 3 week Handle (H)
after forming the right side of a 2 year Cup. If the SOX eventually breaks
out of its Cup and Handle pattern to the upside then KLIC may move
higher as well. 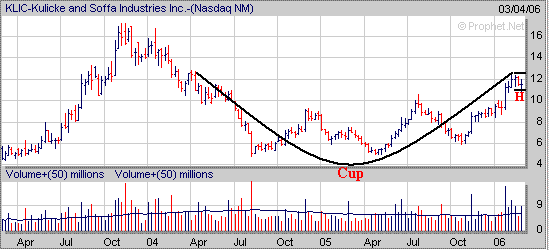
In
2005 our Long Term Investing Strategy finished up 31% while
our Short Term Investing Strategy ended up 64%.
Signup today for a "Free"
2 Week Trial Membership to Amateur Investors and have access to
our current Stocks to Watch Buy List which contains stocks that are currently developing a favorable chart
pattern such as the Cup and Handle, Double Bottom and Flat Base which can be used with either our Long Term
Investing Strategy or Short Term Investing
Strategy.
Also you will have access to these other investment products.
Daily Breakout Reports
Market Timing Indicator
Weekly ETF Buy and Short Signals
Click
Here to Signup for a "Free" 2 Week Trial Membership
Send this Free Newsletter to a Friend or Relative
Amateur-Investors.Com
|


