|
Signup
today and save 50% on a Premium Membership Plan
which includes our Stocks to Watch List and Daily Breakout Reports
Weekend Stock Market Analysis
(3/6/04)
It was another week of consolidation for the major averages as
they have basically remained in a trading range since mid January.
Eventually the trading ranges will be resolved with some type of significant
move either to the downside or upside. The Dow has been trading
between 10400 and 10750 after running into resistance near its longer term 76.4%
Retracement Level calculated from the early 2000 high to the October 2002
low. For the bullish camp it does appear the Dow is developing a longer
term "Cup and Handle" pattern. If the Dow breaks out of its
Handle to the upside then it could make a quick move up to the 11400 area which
was the high made in 2001 (point A). Meanwhile if the Dow breaks to the
downside instead the first level of support below 10400 would be at its 20
Weekly EMA (green line) near 10200. 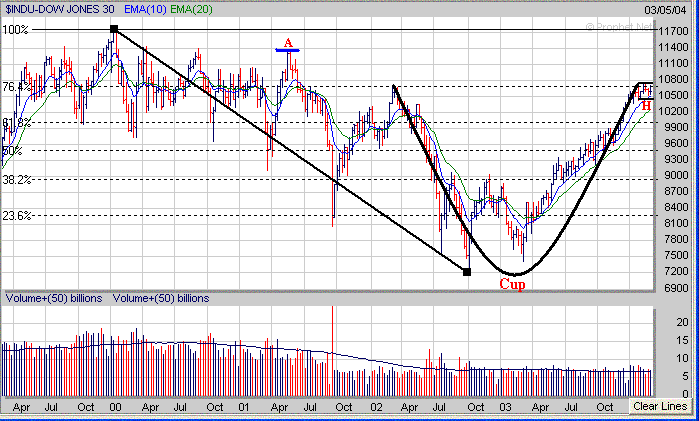
The Nasdaq has been in a
trading range between 1990 and 2155 since mid January and also appears to be
developing a "Cup and Handle" pattern. If the Nasdaq can break
out of its Handle to the upside it could make a move up to the 2300 area.
Meanwhile if the Nasdaq breaks to the downside instead and drops below 2000 then
its next support level would be at its 40 Weekly EMA (purple line) near 1900. 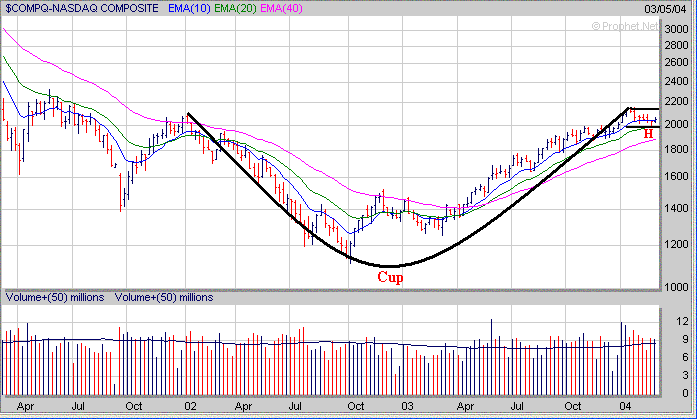
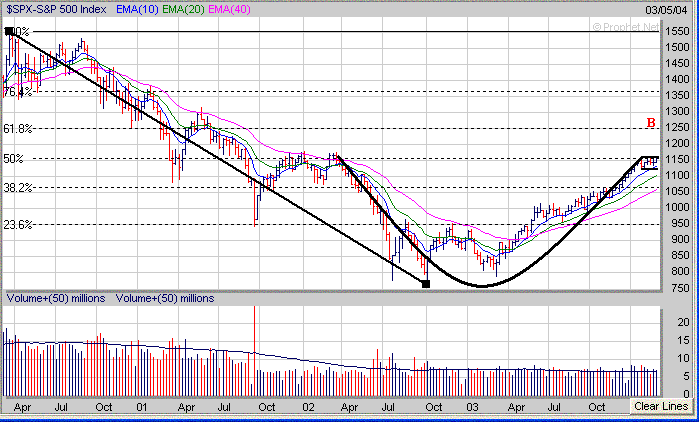
As far as the S&P 500 it has been in a trading range between
1120 and 1160 since mid January after encountering resistance at its longer
term 50% Retracement Level near 1160 (calculated from the early 2000 high to the October
2002 low). Just like the Dow and Nasdaq it also appears the S&P 500 has
developed a "Cup and Handle" pattern. If the S&P 500 breaks
out of its Handle to the upside then look for its next level of upside
resistance around 1250 which is at the 61.8% Retracement Level (point
B). Meanwhile if the S&P 500 breaks out of its Handle to the
downside instead look for initial support around the 1100 area which is at its
20 Weekly EMA (green line).
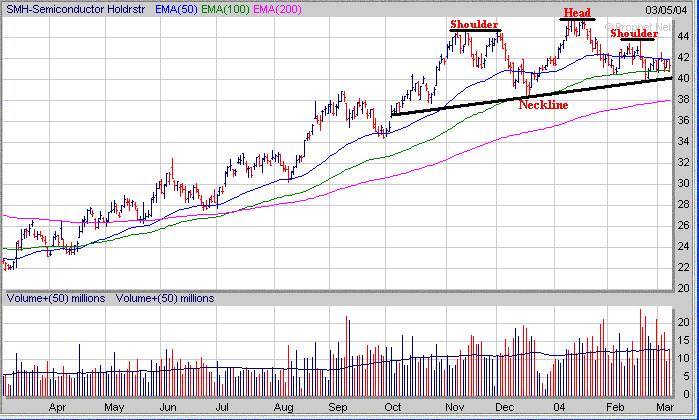
Meanwhile I'm still paying close
attention to the Semiconductor Sector as there will likely have to be renewed
strength in this sector in order for the Nasdaq to breakout of its Handle to the
upside. The Semiconductor Holders (SMH) are still exhibiting a potential
Hand and Shoulders Top pattern and will need to hold support near their Neckline
around 40 in order to remain constructive in the near term. If the SMH's
fail to hold support near the Neckline then look for a drop back to their 200
Day EMA (purple line) near 38 which will likely have a significant impact on the
Nasdaq.
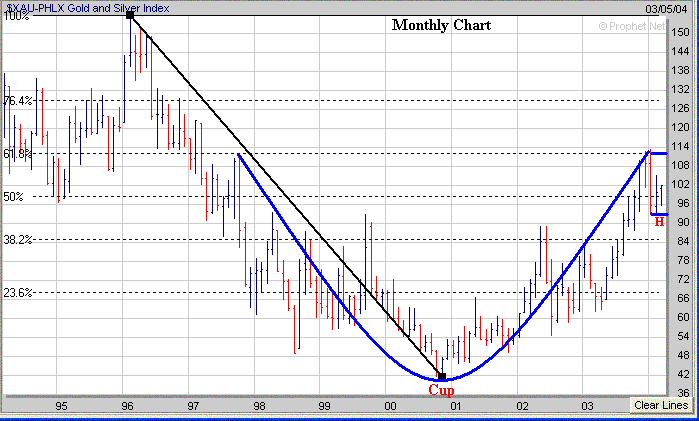
Finally for those of you following the Gold and Silver sector (XAU)
it looks too me that it has found support around the 93 level after encountering
resistance at its longer term 61.8% Retracement Level near 114. It also
appears the XAU is develop a Handle after forming a longer term Cup. If
the XAU can break above the 114 level down the road that would be a bullish sign
and would likely lead to a move up to the longer term 76.4% Retracement Level
near 129.
Over the past few weeks there has been an increasing number of
stocks which have been forming a favorable chart pattern as the market has been
in a consolidation mode. If the major averages do eventually break out of
their trading ranges to the upside those stocks which break out first will
likely become the next market leaders. On occasion you will miss
the first move once a stock breaks out however sometimes they will give you a
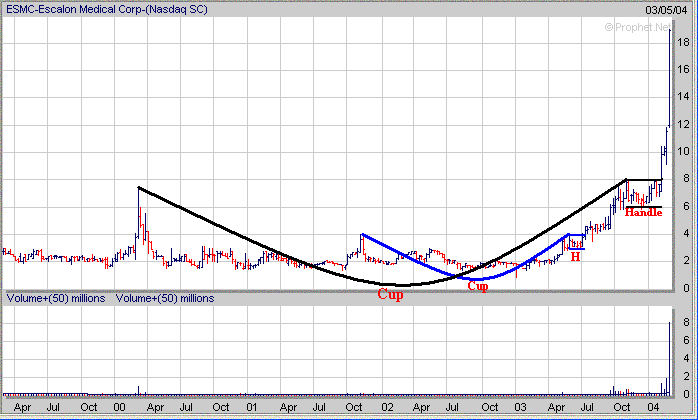
second opportunity. ESMC provides a good example of this as it first broke
out of a smaller "Cup and Handle"
pattern last Summer and went from $4 to $8 for a gain of 100%. After
doubling in price ESMC then developed a trading range between $6 and $8 over the
next 3 months while forming a larger "Cup and Handle"
pattern. ESMC then broke out of its larger "Cup and Handle"
pattern in February and has quickly doubled in price again over the past 4
weeks. Even though you may miss the original breakout attempt many times
strong performing stocks will give you a second opportunity to invest in them.
How can a Premium Membership to amateur-investor.net
benefit you as an investor? We focus on stocks which are exhibiting
favorable Sales and Earnings Growth that have developed a favorable chart pattern such as a "Cup and Handle",
"Double Bottom", "Flat Base" or "Symmetrical
Triangle". These stocks are then
included in our "Stocks to Watch List" which gives investors a
quick reference to those stocks which may provide the best buying opportunities in the weeks ahead. Each stock in
our "Stocks to Watch List"
includes specific Buy Prices, Stop Loss Prices (very important) and projected
Target Prices.
Signup
Today for a "Free" Trial Membership and see our complete list of
Stocks
which are currently developing a favorable Chart Pattern such as the
"Cup and Handle" or "Double Bottom"
Amateur-Investor.net
|

