|
Weekend Stock Market Analysis
(5/13/06)
The market began to unravel this week especially after the
Federal Reserve raised interest rates on Wednesday. Although the near term
doesn't look pretty we have to look at things from a longer term perspective
before pushing the panic button. Let's start with the Dow which
up to this past week had gained nearly 1400 points since making a low in October
of 2005. Since October of 2005 the Dow has basically been in an up trend
while holding support either at its 10 Weely EMA (blue line) or along its upward
sloping trend line (black line). If the Dow does come under more selling
pressure I would look for it to find support either at its 10 Weekly EMA near
11275 or along its upward sloping trend line which is nearing the 11200
level. Unless the Dow breaks below its upward sloping trend line then its
upward bias from the October 2005 low will remain
intact. 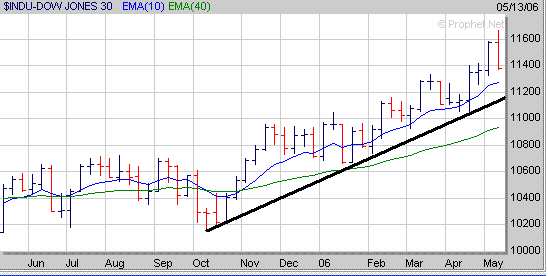
As
for the Nasdaq there is no denying it got crushed the last three trading days of this
week however up until this time it had risen nearly 350 points since making a
bottom in October of 2005. Meanwhile if we look at a longer term weekly
chart of the Nasdaq you can see it has been going through a series of upward
(points A to B) and downward (points B to A) moves since the Summer of 2004 but
the overall trend has been higher. Meanwhile another thing to notice
is that each time the Nasdaq has gone through a correction since the Summer of
2004 it hasn't been able to hold support at its 40 Weekly EMA (blue line) and
has dropped back to its upward sloping trend line (black line). If the
same type of pattern develops this time around then we could see the Nasdaq drop
back to its upward sloping trend line once again which is currently around the
2150 level. Keep in mind until we see the Nasdaq drop below its upward
sloping trend line then its longer term upward bias will remain
intact. 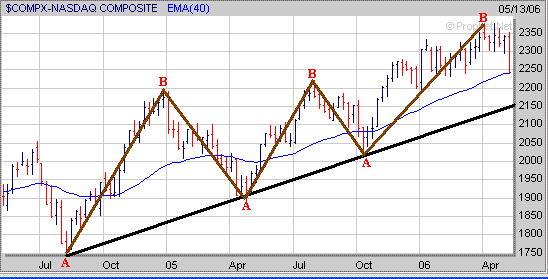
Meanwhile as far as the S&P 500
it had risen over 150 points since making a low in October of 2005 before coming
under selling pressure this week. A longer term weekly chart of the
S&P 500 shows that it has been in a choppy upward trend since the Summer of
2004 and has been making a series of higher highs (points B to C) and higher
lows (points C to B). If the S&P 500 undergoes a multi
week correction once again and is unable to hold support at its 40 Weekly EMA
near 1260 then look for an eventual drop back to its upward sloping trend line
which is currently around the 1230 level. As long as the S&P 500 is
able to hold support at or above its upward sloping trend line (black line)
originating from the low made in the Summer of 2004 then its longer term upward
bias will remain intact. 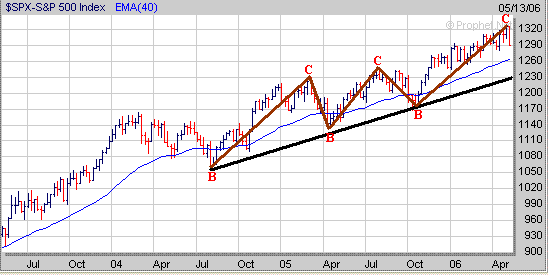
Although nobody likes to see the
market undergo a correction they give us an excellent opportunity to start
noticing which stocks are holding up the best and developing a favorable chart
pattern versus those that aren't. For example AEHR from our
current Top
100 Stocks List has just completed the right side of a 2 1/2 Year Cup and now
needs to start developing a constructive Handle to complete a "Cup and
Handle" pattern. 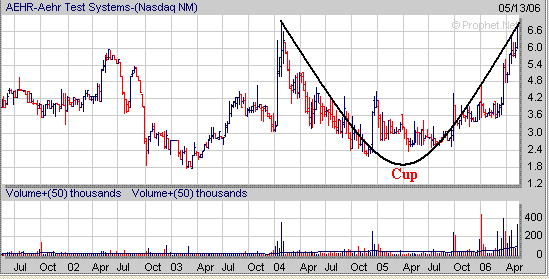
Remember
stocks breaking out of a proper chart pattern such as the "Cup and
Handle" can make significant moves upward. Notice how GFI formed an
11 month Cup followed by a 7 week Handle (H) before breaking out in late 2005
which was followed by a gain of 60% over the next 3 months (points D to E). 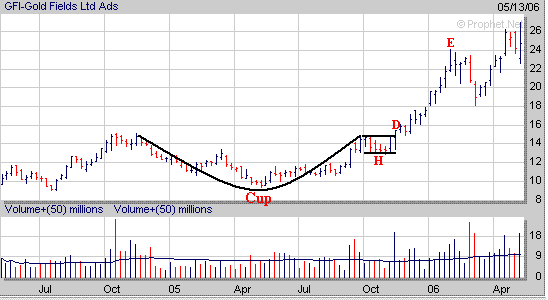
Signup today for a "Free"
2 Week Trial Membership to Amateur Investors and have access to
all of the Stocks in our current Stocks to Watch Buy List which contains stocks that are currently developing a favorable chart
pattern such as the Cup and Handle, Double Bottom and Flat Base which can be used with either our Long Term
Investing Strategy or Short Term Investing
Strategy.
Also you will have access to these other investment products.
Daily Breakout Reports
Market Timing Indicator
Daily ETF Buy and Short Signals
Click
Here to Signup for a "Free" 2 Week Trial Membership
Send this Free Newsletter to a Friend or Relative
Amateur Investors
|


