|
Click
Here to Signup for a Free 2 Week Trial Membership and
have access to our Stocks to Watch List and Daily Breakout Reports
Weekend Stock Market Analysis
(5/14/05)
Of the three major indexes the Nasdaq is starting to act better
than the Dow or S&P 500 which is a shift from earlier in the year when the
Nasdaq peaked in early January and began selling off while the Dow and S&P
500 continued higher and didn't put in a top into early March. Despite
the recent strength in the Nasdaq it's approaching a significant upside
resistance area around 2000 which corresponds to its 200 Day EMA (green line)
and downward sloping trend line (solid brown line) originating from the early
January high. If the Nasdaq can break solidly above the 2000 area this
could signal a change in its longer term direction which has been basically
downward since early January. Meanwhile if the Nasdaq is unable to break
above the 2000 level and begins to come under renewed selling pressure this
would likely lead to a retest of its late April low near 1890 (point A). 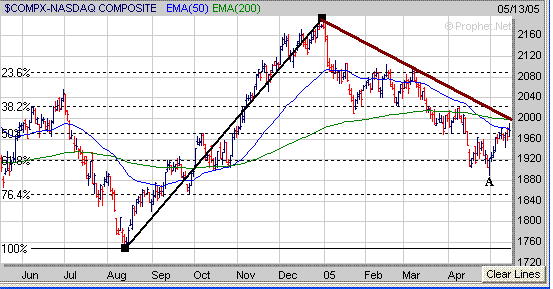
There are two sectors to watch which
may have an impact on the Nasdaq in the weeks ahead. The first is the
Semiconductors as the Semiconductor Holders (SMH) have been rallying of late
after finding support near the 30 level (point B). The SMH's ended the
week by closing just above their 40 Weekly EMA (blue line) near 33. If the
SMH's continue to rally this may help the Nasdaq as well. Meanwhile
look for upside resistance to occur near 35 which is where the SMH's have
stalled out twice before since last October (points C) and corresponds to their
longer term 38.2% Retracement Level (calculated from the October 2002 low to the
early 2004 high). 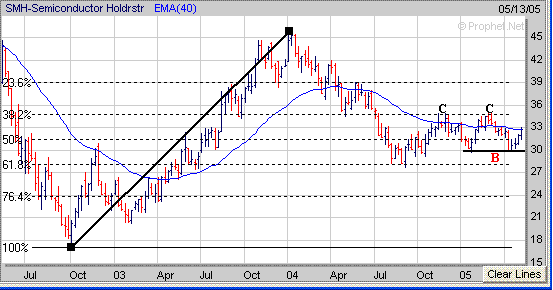
Meanwhile another sector to keep an
eye on is the Biotechs (BTK). As I mentioned in the Mid Week Market
Analysis the Biotechs have developed a longer term Symmetrical Triangle pattern
as their downward and upward sloping trend lines (solid black lines) are
converging. This type of pattern usually signals that a substantial move
in one direction of the other is nearing. If the Biotechs can break
solidly above the 560 level then this would have a positive affect on the Nasdaq.
However if the Biotechs break strongly below 480 then this would likely have a
negative affect on the Nasdaq. 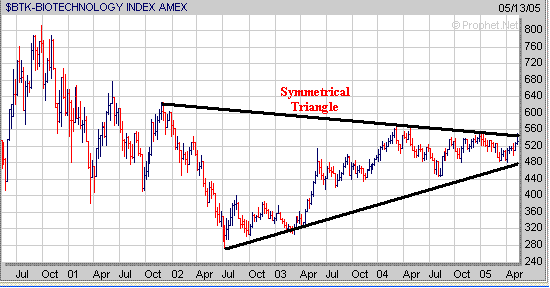
As far as the other two major
indexes the Dow encountered strong upside resistance near 10400 early in the
week which corresponded to its 50 Day EMA (blue line) and 200 Day EMA (green
line) and then got sold off the rest of the week. The Dow has a key short
term support level near 10000 which corresponds to its 76.4% Retracement Level
(calculated from the October 2004 low to the early March high). If the Dow
fails to hold support near 10000 then its next major support area would be at
its October 2004 low near 9700 (point D). 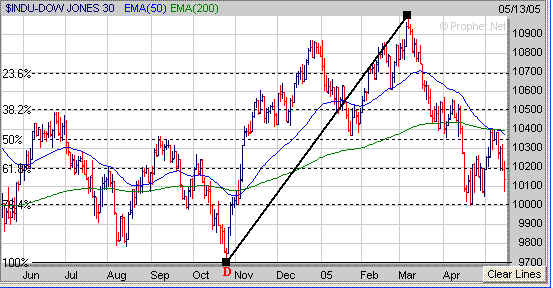
As for the S&P 500 it stalled
out near 1180 early in the week and also came under selling pressure the rest of
the week. The S&P 500 has a key short term support level near 1137
(point E) which was the mid April low. If the S&P 500 fails to hold
support near 1137 then its next support level would be around 1125 (point F)
which corresponds to its 61.8% Retracement Level (calculated from the August
2004 low to the early March high). 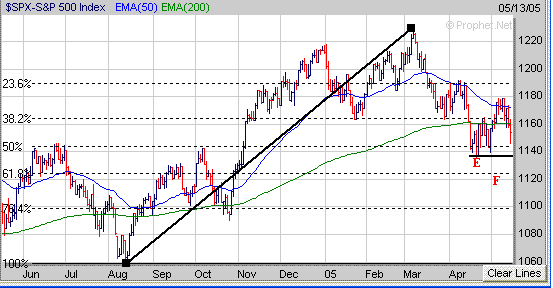
For those watching the price of
Crude Oil the prices continue to drop and a key support level exists near 48
which corresponds to its 40 Weekly EMA (blue line). We saw the same type
of action in late 2004 when the price of Crude Oil sold off and dropped back
close to its 40 Weekly EMA (points G to H). This was then followed by a
strong rally from January through March (points H to I). Thus the question
remains what will happen this time if the price of Crude Oil drops back to its
40 Weekly EMA. Will the price of Crude Oil find support near 48 and then
rally strongly like occurred earlier in the year or will it break below 48
leading to a much bigger drop back to its late 2004 levels in the lower 40's? 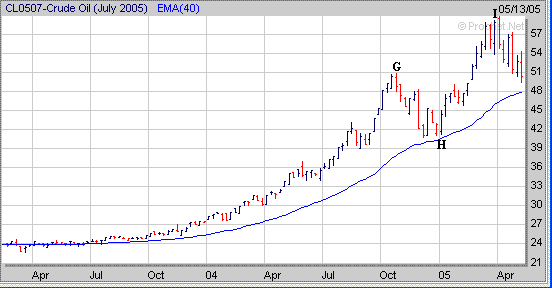
Finally although the market has been
frustrating for most investors so far in 2005 continue to be patient and
maintain a list of stocks which are holding up the best and developing a
favorable chart pattern. A current example of a stock we are
watching from our database is ASF which has formed the right side of a 1 year
Cup. What we would like to see over the next few weeks is for ASF to
develop a constructive Handle to complete a "Cup and Handle" pattern
before attempting to move higher. 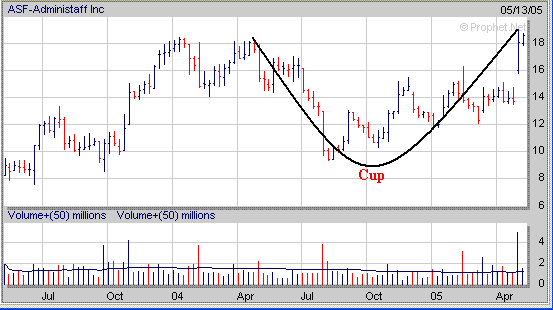
Signup today for a "Free"
2 Week Trial Membership and have access to our Stocks
to Watch List which provides a list of Stocks that are exhibiting a
favorable Chart Pattern such as the "Cup and Handle", "Double
Bottom" and "Flat Base". Also you
will receive our Daily Breakout Report
by email which Alerts you to Stocks that
are breaking out of a favorable Chart Pattern from our Stocks
to Watch List.
Amateur Investors Performance versus the Major Averages
(1/1/05-5/13/05)
Amateur Investors: +13.9%
Dow:
-6.0%
Nasdaq:
-9.4%
S&P
500:
-4.8%
Click
Here to signup for a "Free" 2 Week Trial Membership
Amateur-Investor.net
|

