|
Signup
today and save 50% on a Premium Membership Plan
which includes our Stocks to Watch List and Daily Breakout Reports
Weekend Stock Market Analysis
(5/15/04)
The market tried to bounce from oversold conditions this week
but really didn't have too much success. The Dow broke below its 40 Weekly
EMA (purple line) this week as well as its longer term 23.6% Retracement Level
(calculated from the October 2002 low to the early 2004 high) just above
9900. One of two things are possible over the next few weeks. Either
the Dow will hold support near 9900 and eventually rally back to where its 10
Weekly EMA (blue line) and 20 Weekly EMA (green line) are converging at just
below 10300 or it will break strongly below the 9900 area leading to a more
substantial drop back to around 9400 which is at its longer term 38.2%
Retracement Level (point A). 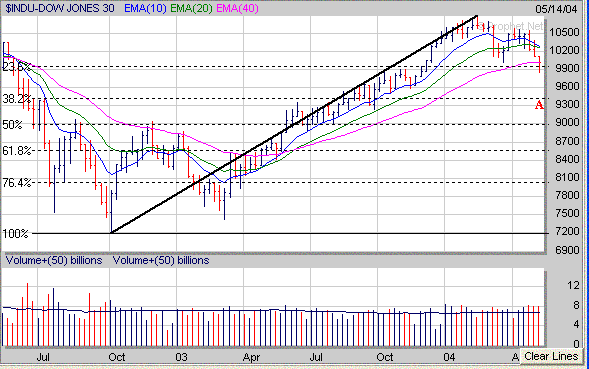
The Nasdaq is also below its 40
Weekly EMA (purple line) and appears to have a key support level near
1880. If the Nasdaq can hold support next week around 1880 and then
undergo a rally look for upside resistance around 1980 which is where its 10
Weekly EMA (blue line) and 20 Weekly EMA (green line) are converging at.
Meanwhile if the Nasdaq gaps strongly below the 1880 area this spells big
trouble as its next support area would probably be at its longer term 38.2%
Retracement Level (calculated from the October 2002 low to the early 1004 high)
near 1760 (point B). 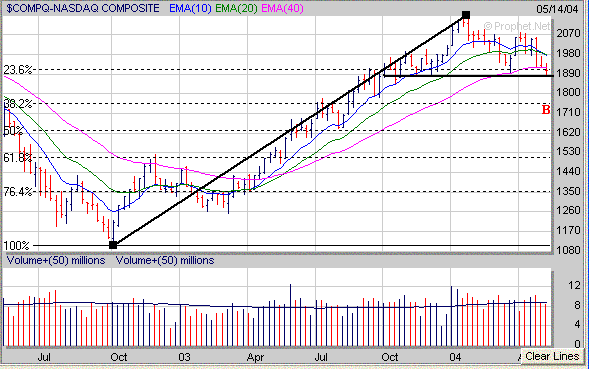
The S&P 500 so far has held
support above its 40 Weekly EMA (purple line) and longer term 23.6% Retracement
Level (calculated from the Octboer 2002 low to the early 2004 high). If
the S&P 500 can hold support above 1070 next week and attempts to rally look for upside resistance in the 1115
to 1120 which coincides with its 10 Weekly EMA (blue line) and 20 Weekly EMA
(green line). Meanwhile if the S&P 500 drops below 1070 this would
likely lead to a substantial drop as its next downside support level would
probably be at its longer term 38.2% Retracement Level near 1015 (point C). 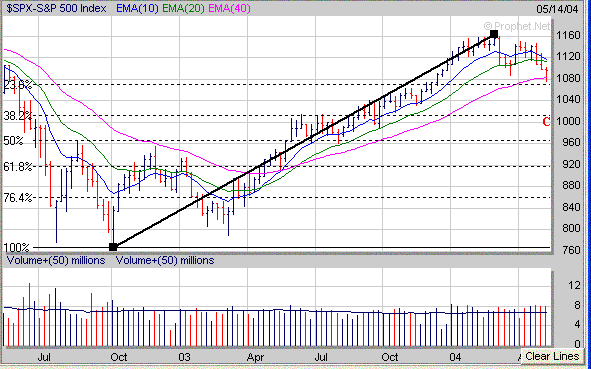
As far as a few sectors the Banks (BKX)
fell below their 40 Weekly EMA this week as well as their longer term 23.6%
Retracement Level. If the BKX attempts to rally next week and rises above its 40 Weekly EMA
look for strong upside resistance just above 96 which is where its 10 Weekly EMA
(blue line) and 20 Weekly EMA (green line) are converging at. Meanwhile if
the BKX fails to hold support near the 91 area then look for its next area of
downside support at its longer term 38.2% Retracement Level just above 87 (point
D). 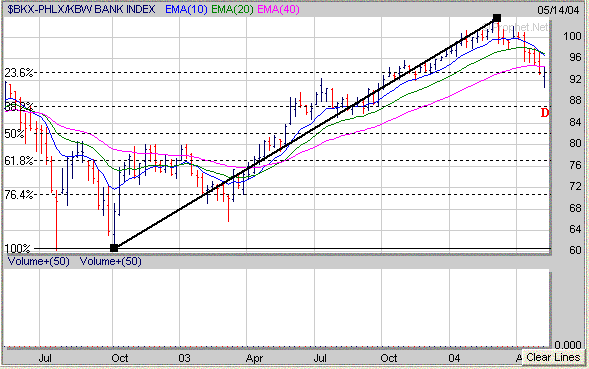
The Semiconductor Holders (SMH)
tried to rally this week but stalled out near 38 which is just below where their 10 Weekly
EMA (blue line) and 40 Weekly EMA (purple line) are converging at. The key
support area to watch next week is near their longer term 38.2% Retracement
Level just above 34.50. If the SMH's break below 34.50 then this may
eventually lead to a drop back to their longer term 50% Retracement Level near
31.50 (point E). 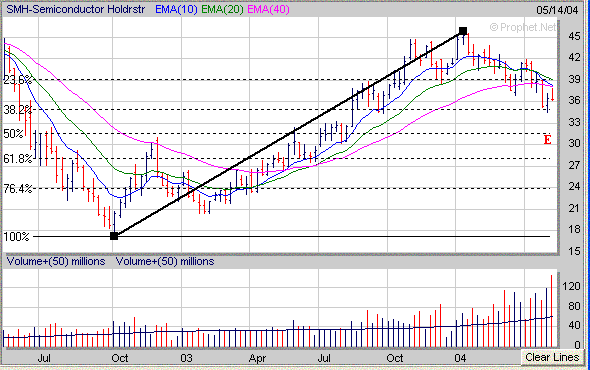
Meanwhile its been a while since I
talked about the Put to Call Ratio and the Bullish-Bearish Indicator. The
running 5 Day Average of the Put to Call Ratio shows that it spiked up
strongly this week which means investors are beginning to worry about the longer
term outlook for the market. Another thing I have noticed over the past
few years is that once the Put to Call Ratio has initially risen well above 1.0
(points F) that the market will bounce for a brief period of time before heading
lower and eventually making a bottom (points G) a month or so later followed by
a strong upside reversal. If a
similar pattern is developing now will the major averages have to trend lower
before we see a significant bottom develop sometime in June. 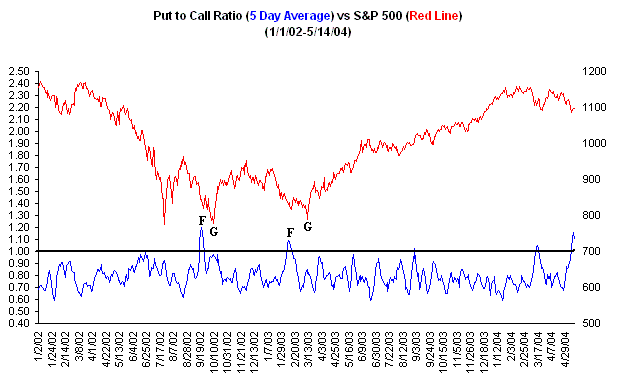
As far as the Bullish-Bearish
Indicator since 1997 most significant market bottoms (points H) have occurred
when the % difference between the Bullish and Bearish Investment Advisors has
narrowed and approached zero (black circles). In fact in some cases the %
of Bearish Advisors was greater than the % of Bullish Advisors. Right now
there is still quite a spread between the Bullish and Bearish Investment
Advisors although the % difference has been steadily decreasing since early
March. If this trend continues and the % difference between the Bullish
Advisors and Bearish Advisors approaches zero in the weeks ahead this could be a
strong signal that a significant bottom is nearing. Thus I will be
watching this indicator closely over the next few weeks especially if the major
averages come under more selling pressure. 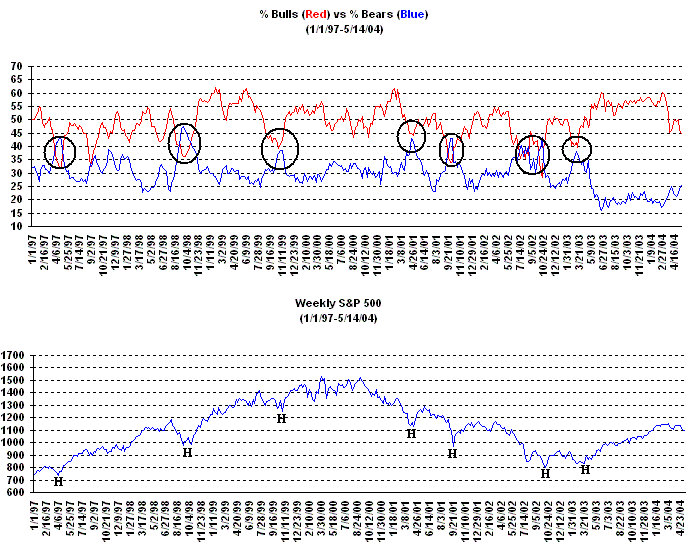
How can a Premium Membership to amateur-investor.net
benefit you as an investor? We focus on stocks which are exhibiting
favorable Sales and Earnings Growth that have developed a favorable chart pattern such as a
"Cup and Handle",
"Double Bottom", "Flat Base" or "Symmetrical
Triangle". These stocks are then
included in our "Stocks to Watch List" which gives investors a
quick reference to those stocks which may provide the best buying opportunities
to the long side in the weeks ahead. Each stock in
our "Stocks to Watch List"
includes specific Buy Prices, Stop Loss Prices (very important) and projected
Target Prices.
Our Performance so far in 2004 is shown below as compared to the major averages.
Performance (Long Strategy) vs Major
Averages
(1/1/04-5/14/04)
|
Amateur Investors +26.5%
|
|
| Dow
-4.2% |
|
| Nasdaq
-4.9% |
|
|
S&P 500
-1.4% |
|
Signup
Today for a "Free" Trial Membership
and see which Stocks to Buy or Short in the weeks ahead
Amateur-Investor.net
|


