|
Weekend Stock Market Analysis
(5/20/06)
The last week and a half hasn't been pretty as strong selling
pressure has occurred in the major averages. The Dow has fallen over 600
points since peaking seven trading days ago near the 11650 level and has broken
below its 50 Day EMA (blue line) and upward sloping trend line (brown line)
originating from the October 2005 low. At this point one of two things may
occur next week in the Dow. If the Dow can hold support at its 38.2%
Retracement Level near 11100 then we could see a brief oversold rally
develop. However if the Dow is unable to hold support near the 11100 level
and continues lower then its next area of support would be around the 10950 area
which coincides with its 200 Day EMA (green line) and 50% Retracement
Level. 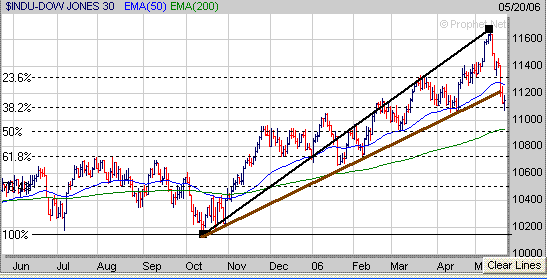
The
Nasdaq which topped out five weeks ago near 2375 fell around 200 points during
the past seven trading days and is now well below its 40 Weekly EMA (blue
line). However despite the Nasdaq getting hammered it still remains above
its longer term upward sloping trend line (black line) which originates from the
low made in August of 2004. The longer term outlook for the Nasdaq will
likely depend on whether it can hold support along its upward sloping trend line
or not over the next week or two which appears to be in the 2130-2150 range. If the Nasdaq were to break below its upward sloping term trend
line then that could eventually lead to a much larger drop back to its October
2005 low around the 2030 level (point A) at some point. 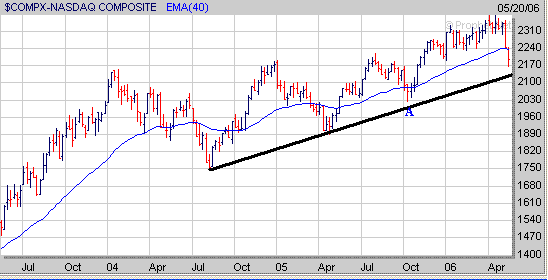
As far as the S&P 500 it has
dropped nearly 70 points over the past seven trading days and briefly broke below its 40 Weekly EMA (blue line).
However just like the Nasdaq despite the
large drop over the past seven trading days the S&P 500 still remains above
its longer term upward sloping trend line which is currently around the 1230
level. As we have seen since the Summer of 2004 after the S&P 500 has
gone through an extended rally (points B to C) it has undergone a correction and
dropped below its 40 Weekly EMA on three separate occasions (points C to
B). Thus if this pattern is repeated again then the S&P 500 could
eventually drop back to the 1230 level at some point. 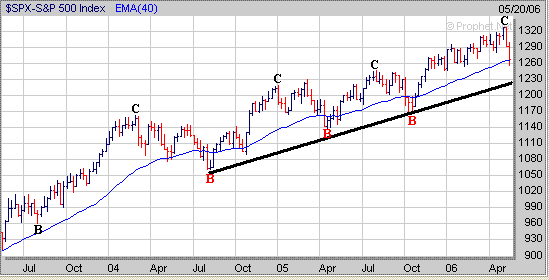
This week we saw quite a
jump in the Put to Call Ratio and the Volatility Index (VIX) as investors began
to panic. The 5 Day Moving Average (MA) of the Put to Call Ratio
is now around 1.25 (point D) which is the highest it has been since the Fall of
2002. In the past when the 5 Day MA of the Put to Call Ratio has risen
well above 1.0 (points E) this has been followed by an oversold bounce of
differing magnitudes. Since 2002 there have been six times the 5 Day MA of
the Put to Call has risen well above 1.0. On three occasions this was
followed by a brief oversold bounce that last for a week or so and then was
followed by more selling pressure (points F to G). Meanwhile on the other
three occasions when the 5 Day MA of the Put to Call Ratio rose well above 1.0
this was followed by a multi-week rally (points H to I). 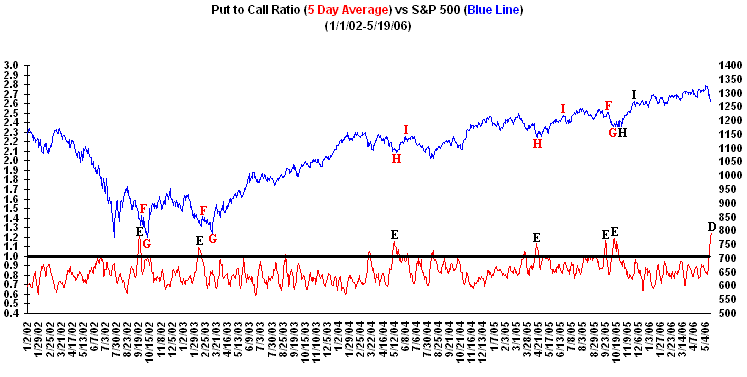 Meanwhile the Volatility Index (VIX)
rose substantially as well this week and reached a level not seen since April of
2005. Over the past few years when there has been a rapid rise in the VIX
(points J to K) this has been followed by an oversold rally of differing
magnitudes (points L to M). 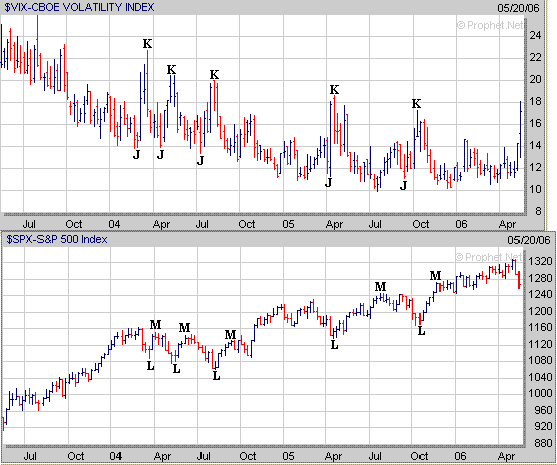
Based on what happened in the Put to
Call Ratio and VIX this week I believe we may see an oversold bounce develop
next week. However I also believe there is a good chance that it will
be of short duration and may only last for a week or so and then could be
followed by more selling pressure as we move into June. No matter what happens in
the weeks ahead this is a good time to start noticing which stocks are holding
up well as this will will give you a clue to whom the next market leaders will
be in the future. For example LTXX from our Top 100 List has
formed a "Double Bottom" pattern and now needs to start developing a
constructive Handle in the weeks ahead. 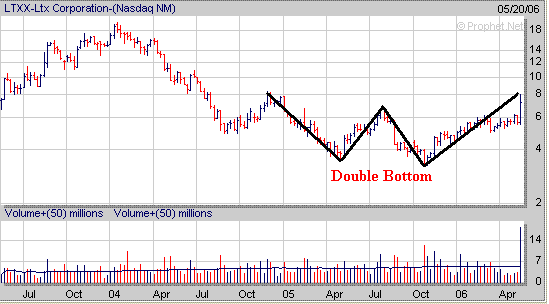
Signup today for a "Free"
2 Week Trial Membership to Amateur Investors and have access to
all of the Stocks in our current Stocks to Watch Buy List which contains stocks that are currently developing a favorable chart
pattern such as the Cup and Handle, Double Bottom and Flat Base which can be used with either our Long Term
Investing Strategy or Short Term Investing
Strategy.
Also you will have access to these other investment products.
Daily Breakout Reports
Market Timing Indicator
Daily ETF Buy and Short Signals
Click
Here to Signup for a "Free" 2 Week Trial Membership
Send this Free Newsletter to a Friend or Relative
Amateur Investors
|

