|
Click
Here to save 50% on Premium Membership to amateur-investor.net
and have access to our Stocks to Watch List and Daily Breakout Reports
Weekend Stock Market Analysis
(5/21/05)
Although it has been choppy at times we have seen a decent
oversold rally develop in the major averages since mid April. Once again
we appear to be seeing some correlation to the price of Crude Oil and the
performance of the Dow. During the past year or so when the price of Crude
Oil has rallied (points A to B) the Dow has sold off (points C to D) and when
the price of Crude Oil has sold off (points B to A) the Dow has rallied (points
D to C). 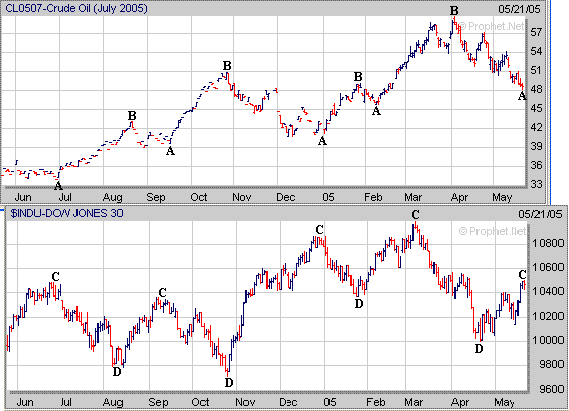
Meanwhile the price of Crude Oil is
nearing a key support level at its 200 Day EMA (green line) around 47.50 as it
has been under selling pressure since early April. The current pattern in
Crude Oil looks somewhat similar to what transpired in the latter part of 2004
when the price of Crude Oil dropped considerably (points E to F) but held
support above its 200 Day EMA before making a significant upward from January
through March (points F to G). Further movement in the major
averages may hinge on what happens to the price of Crude Oil over the next few
weeks. If the price of Crude Oil holds support near its 200 Day EMA this
could eventually lead to a significant rally much like occurred from January
through March which would likely lead to renewed selling pressure in the major
averages. However if the price of Crude Oil fails to hold support
near its 200 Day EMA then look for a drop back to its late 2004 level in the
lower 40's (point F) which would likely have a positive affect on the major
averages. 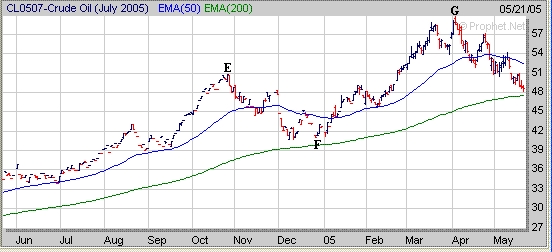
As for the major averages the Dow
has rallied around 500 points since mid April and has risen up to its 38.2%
Retracement Level near 10500 (calculated from the October low to the early March
high). If the Dow stalls out in the 10500 to 10500 range and comes under
some selling pressure look for support near 10400 which is where its 50 Day EMA
(blue line) and 200 Day EMA (green line) are near. Meanwhile if the Dow
doesn't stall out and can break above the 10550 level (point I) then it's next
area of upside resistance would probably be near its 23.6% Retracement Level
just below 10700 (point J). 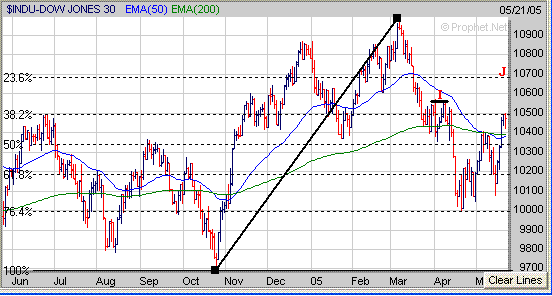
The Nasdaq has rallied around 150
points since making a bottom in the latter half of April and has broken above
its downward sloping trend line (brown line) originating from the early January
high. The question at this point is will the Nasdaq now pullback some and
consolidate its recent gains before attempting to move higher? If the
Nasdaq does stall out and pulls back some look for support at its 200 Day EMA
(green line) near 2000. Meanwhile if the Nasdaq doesn't pullback and
continues higher its next area of upside resistance appears to be in the 2090 to
2100 range which coincides with its 23.6% Retracement Level and is where it
stalled out twice before in February and March (points K). 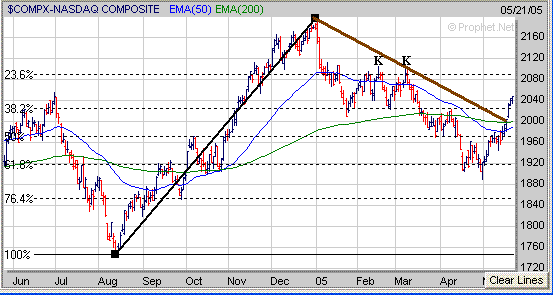
One sector to watch which will
continue to affect the Nasdaq is the Semiconductors (SOX). Although the
SOX has broken above its 40 Weekly EMA (blue line) it could possibly run into
some resistance near 430 which is at its 38.2% Retracement Level (calculated
from the January 2004 high to the September 2004 low). Meanwhile if the
SOX can break above the 430 level then its next area of upside resistance would
be around 455 which is at its 50% Retracement Level and is where it stalled out
at last November (point L). If the Nasdaq is going to rally up to the 2090
to 2100 level mentioned above the SOX will likely have to rise back to the 455
area. 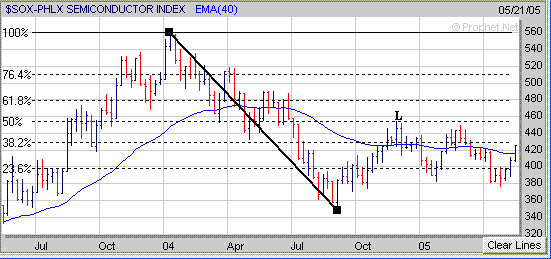
The S&P 500 has rallied around
55 points after making a bottom in mid April and has risen back to its 23.6%
Retracement Level (calculated from the August low to the early March high) near
1190. If the S&P 500 stalls out near 1190 and pulls back some look for
support at its 50 Day EMA just above 1175. Meanwhile if the S&P 500
continues higher instead look for its next area of upside resistance possibly
around 1210. 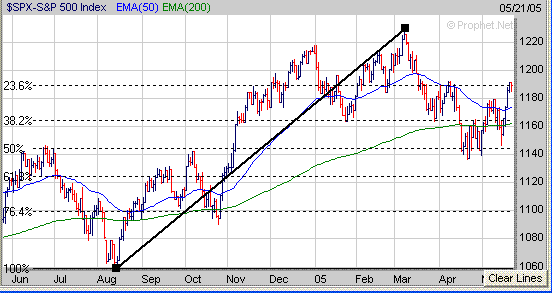
Considering
how strongly the market performed this past week it wouldn't surprise me if we
see some type of consolidation/pullback develop next week before the major
averages make another move higher. Of course as I mentioned in the
beginning what happens to the price of Crude Oil in the weeks ahead may have a
substantial impact on the market. Finally
continue to search for those stocks which are developing a favorable chart
pattern. Over the past few weeks I have mentioned GILD as one to
watch. GILD attempted to breakout of its 4 week Handle (H) this past week
however volume wasn't that strong so it will be interesting to see if this
breakout attempt will follow through or not. 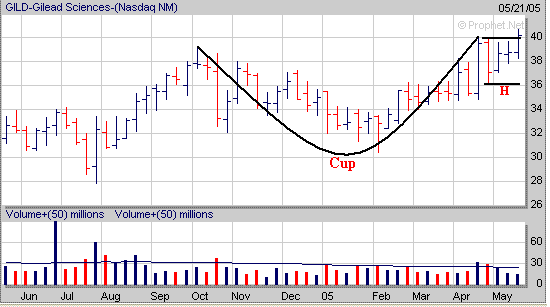
Signup today for a 2
Week Trial Membership and have access to our Stocks
to Watch List which provides a list of Stocks that are exhibiting a
favorable Chart Pattern such as the "Cup and Handle", "Double
Bottom" and "Flat Base". Also you
will receive our Daily Breakout Report
by email which Alerts you to Stocks that
are breaking out of a favorable Chart Pattern from our Stocks
to Watch List.
Click
Here to signup for a "Free" 2 Week Trial Membership
Amateur-Investor.net
|


