|
Weekend Stock Market Analysis
(5/27/06)
We finally saw an oversold bounce develop in the major averages
the last three days of the week. The Dow seems to have found support in the near
term at its April low near 11030 (point A). If the Dow follows through
next week to the upside look for possible resistance to develop where it stalled
out at in mid March near 11350 (point B). Meanwhile if the Dow doesn't
follow through to the upside and begins to come under more selling pressure look
for support either at 11030 or at its 200 Day EMA (green line) near 10950. 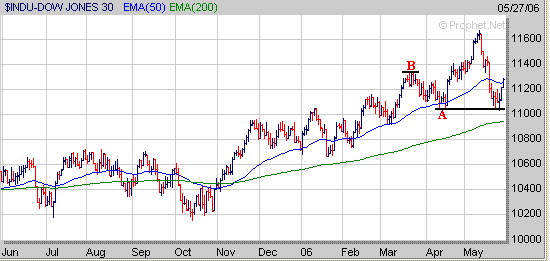
The Nasdaq found support this week
near 2135 which coincided with its longer term upward sloping trend line (brown
line) originating from the low made in the Summer of 2004. In addition the
2135 area is also where the Nasdaq's 38.2% Retracement Level (calculated from
the Summer 2004 low to the most recent high) comes into play at as well. 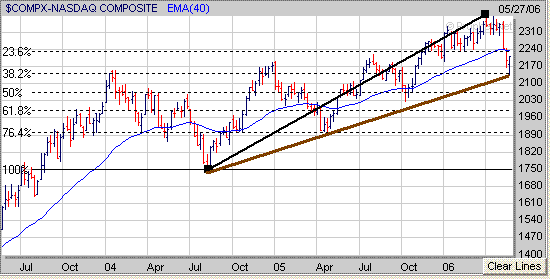
If
the Nasdaq follows through to the upside next week look for possible resistance
to occur around the 2233 area which corresponds to the Nasdaq's 200 Day EMA
(blue line) and also was a previous support level earlier in the year. 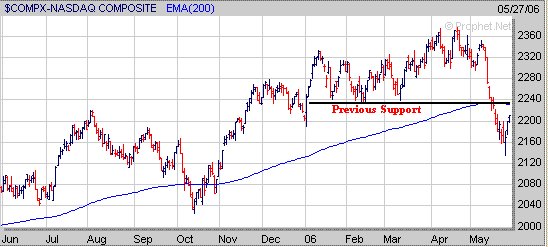
Meanwhile if the Nasdaq doesn't
follow through to the upside next week and comes under more selling pressure
look for initial support at the 2135 level which is a key longer term support
area. If the Nasdaq breaks below the 2135 level at some point then that
would likely lead to another significant move lower with it dropping back to
either its 50% Retracement Level near 2060 or its 61.8% Retracement
Level just below the 2000 area. 
Keep
in mind the once sector that will continue to have an impact on the Nasdaq is
the Semiconductors. The Semiconductor Index (SOX) has basically been in a
downtrend after encountering longer term resistance at the 560 level in January and has
dropped back to its 50% Retracement Level near 455. If the SOX can hold
support near the 455 level and then attempt to rally then this should allow for
the Nasdaq to follow through to the upside in the near term. However if
the SOX fails to hold support near the 455 level and continues lower then look
for it to drop back to its 61.8% Retracement Level near 430 (point C) which
would likely cause the Nasdaq to go lower as well. 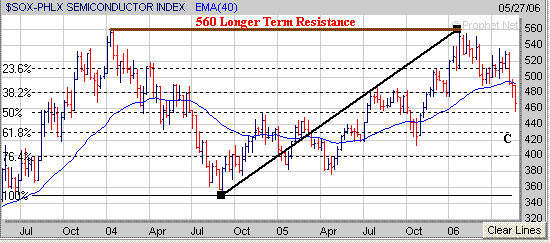
As far as the S&P 500 it found
support this week at its 50% Retracement Level (calculated from the October 2005
low to the most recent high) near the 1245 level. If the S&P 500
follows through to the upside next week look for possible resistance to occur
near the 1290 level which corresponds to its 50 Day EMA (blue line) and 23.6%
Retracement Level. 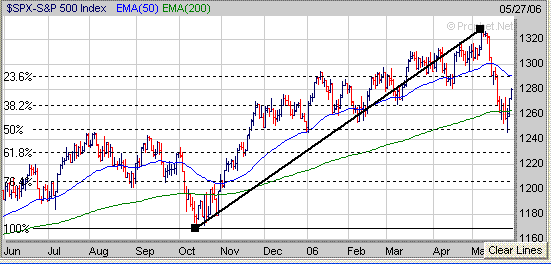
Meanwhile
if the S&P 500 fails to follow through next week and is unable to hold hold
support near the 1245 level then its next level of support would be around the
1230 area. The 1230 level is a key longer term support area for the
S&P 500 as it coincides with its upward sloping trend line (brown line)
originating from the Summer 2004 low. In addition the S&P 500's longer
term 38.2% Retracement Level (calculated from the Summer 2004 low to the most
recent high) is also near the 1230 level as well. Thus if the S&P 500 is
going to continue its longer term trend of making higher highs and lower lows it
must hold support near the 1230 level in the weeks ahead. 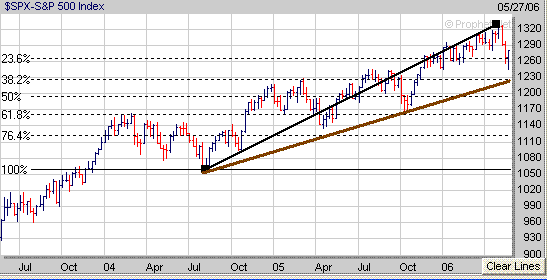
Finally
we saw a sharp downside reversal in the Volatility Index (VIX) this week after
it rose sharply the previous two weeks. The last time we saw a reversal of
this magnitude was in March of 2004 (point D). If we look at what happened
in March of 2004 to the S&P 500 it peaked in the middle part of the month
and then went through a 3 week correction (points E to F). This was then
followed by a brief oversold rally for about a week and a half (points F to G)
which was then followed by more selling pressure as the S&P 500 made a lower
low (points G to H). It wouldn't surprise me if the S&P 500
follows a similar pattern over the next 6 weeks or so with a brief oversold
rally eventually followed by more selling pressure with an eventual drop down to
the 1230 level at some point. 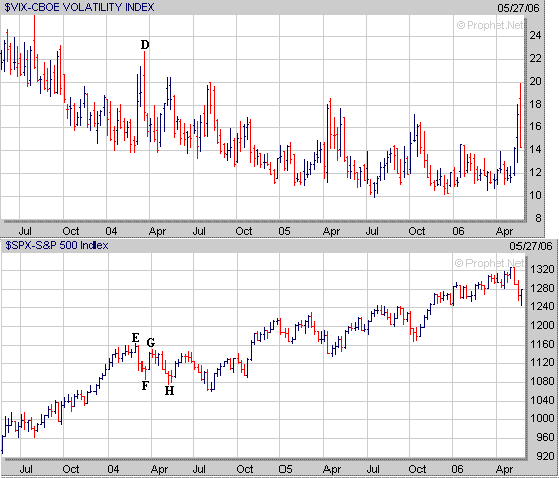
Although the market has been in a
correction recently now is not the time to panic and give up. Corrections give
investors the opportunity to start noticing which stocks are holding up the best
and beginning to develop a favorable chart pattern as those will be the stocks
that may eventually lead the market higher once the correction ends. For
example AEHR from our Top 100 List has held up well so far after forming the
right side of a 2 1/2 year Cup. Over the next few weeks AEHR now needs to
start developing a constructive Handle to complete a favorable "Cup and
Handle" pattern. 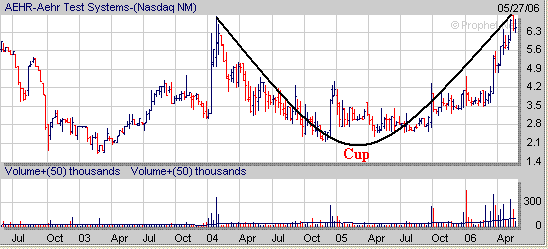
Signup today for a "Free"
2 Week Trial Membership to Amateur Investors and have access to
all of the Stocks in our current Stocks to Watch Buy List which contains stocks that are currently developing a favorable chart
pattern such as the Cup and Handle, Double Bottom and Flat Base which can be used with either our Long Term
Investing Strategy or Short Term Investing
Strategy.
Also you will have access to these other investment products.
Daily Breakout Reports
Market Timing Indicator
Daily ETF Buy and Short Signals
Click
Here to Signup for a "Free" 2 Week Trial Membership
Send this Free Newsletter to a Friend or Relative
Amateur Investors
|


