|
Weekend Stock Market Analysis
(5/6/06)
The Dow and S&P 500 made new 52 week highs this week as
there was some weakness in the price of Crude Oil. As we have seen in the
past when the price of Crude Oil has dropped (points A to B) this has allowed
for the Dow to rally (points C to D). The most recent correction in the
price of Crude Oil started in mid April (points E to F) which has coincided with
a rally in the Dow (points G to H). 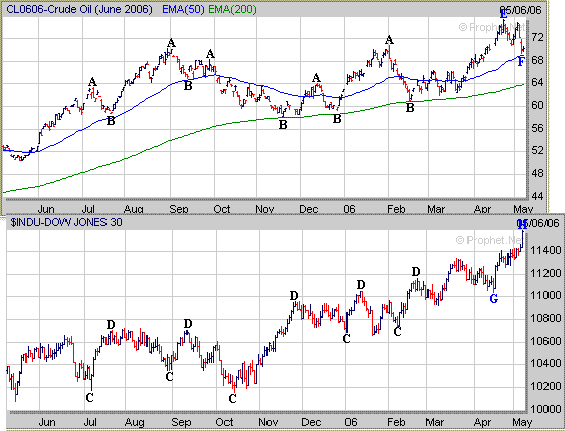
In the near term the price of Crude
Oil has a key support level at its 50 Day EMA (blue line) near the 69 level and
the question is will it hold support at this level or not in the days
ahead. At this time there are two possible scenarios for the price of
Crude Oil. If the price of Crude Oil fails to hold
support at its 50 Day EMA then it could eventually drop back to its 200 Day EMA
(green line) near 64 which would likely allow for the Dow to continue higher
much like we saw last February when the Crude Oil broke below its 50 Day EMA
(points I to J). Meanwhile the second scenario would be for the price of
Crude Oil to hold support at its 50 Day EMA which would then be followed by a
rally eventually leading to a new high much like occurred in July of 2005
(points K to L). In this case the
Dow topped out in July of 2005 and then came under some selling pressure (points K to L). 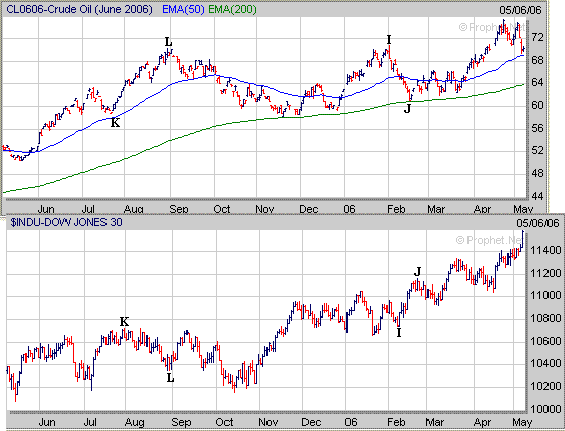
As far as the major averages the Dow
broke above a previous longer term resistance level this week near 10400 and now
is less than 200 points away from its all time high made in the early part of
2000 near 11750 (point M). As mentioned above if the price of Crude Oil
drops below its 50 Day EMA near 69 then this may allow for the Dow to reach its
all time high near 11750. 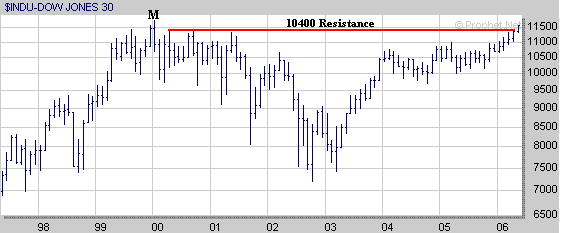
The Nasdaq held support this week at
its mid April low near 2300 and then began to rally on Thursday. If the
Nasdaq can follow through to the upside look for upside resistance near the 2375
level which is where it stalled out at twice in the month of April. 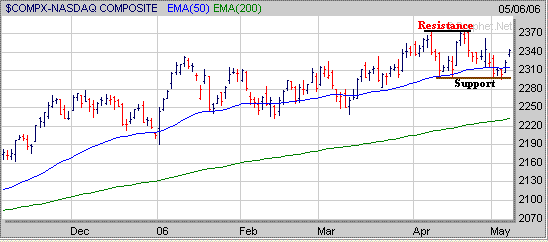
Meanwhile if we look at a longer
term chart of the Nasdaq on a logarithmic scale we can see that the 2375 level
is very close to the Nasdaq's 50% Retracement Level (calculated from the early
2000 high to the late 2002 low) so this might explain why it has been unable to
break above the 2375 level. Thus if the Nasdaq is able to rally back to
the 2375 level it will be interesting to see if it will stall out once again
near this level. 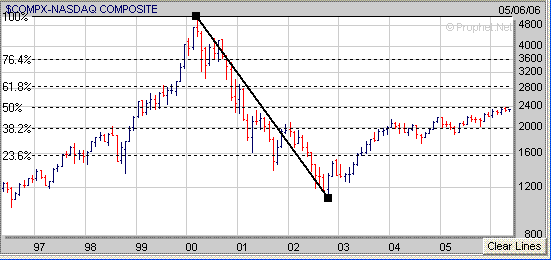
As
far as the S&P 500 it held support just over a week ago at its 50 Day EMA
(point N) and made a new 52 week high on Friday. 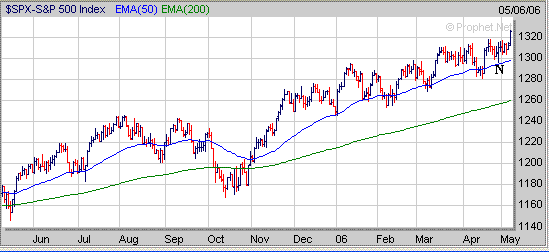
Meanwhile if the S&P 500 can
follow through to the upside its next area of upside resistance appears to be
around the 1360 level (point O) which coincides with its 76.4% Retracement Level
(calculated form the early 2000 high to the late 2002 low). 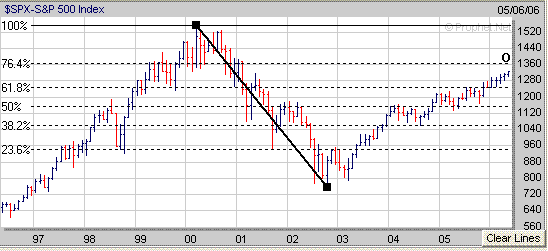
Finally if the major averages
continue higher focus on those stocks breaking out of a favorable chart pattern
such as a Flat Base. Many times after a stock has made a move higher it
will then consolidate for a period of time before moving higher again. TRN
provides a good example of a stock which developed two separate Flat Bases (FB)
the past 6 months before eventually moving higher again and making a $10 move
upward. Although we missed the first Flat Base breakout in mid January we
noticed TRN developing a second Flat Base in March and were able to take
advantage of the recent $10 move higher as it began to breakout in
early April. 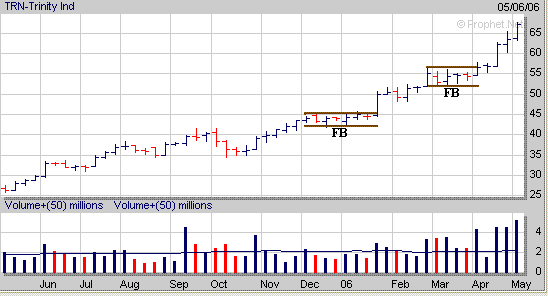
Signup today for a "Free"
2 Week Trial Membership to Amateur Investors and have access to
all of the Stocks in our current Stocks to Watch Buy List which contains stocks that are currently developing a favorable chart
pattern such as the Cup and Handle, Double Bottom and Flat Base which can be used with either our Long Term
Investing Strategy or Short Term Investing
Strategy.
Also you will have access to these other investment products.
Daily Breakout Reports
Market Timing Indicator
Daily ETF Buy and Short Signals
Click
Here to Signup for a "Free" 2 Week Trial Membership
Send this Free Newsletter to a Friend or Relative
Amateur Investors
|


