|
Signup
today and save 50% on a Premium Membership Plan
which includes our Stocks to Watch List and Daily Breakout Reports
Weekend Stock Market Analysis
(5/8/04)
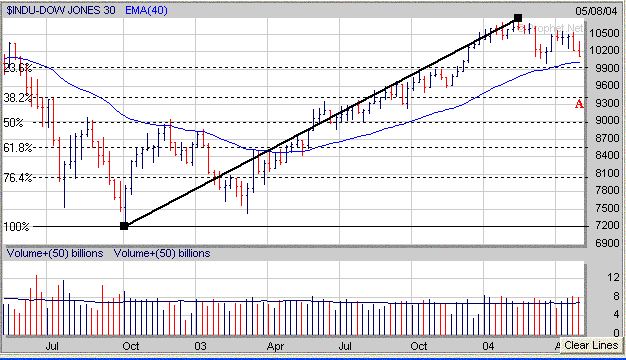
This coming week could be a defining week for the major averages
as they are getting very close to key support levels. The Dow needs to
hold support next week in the 9900-10000 range. The 10000 level coincides
with its late March low and 40 Weekly EMA (blue line) while the 9900 area is at
its longer term 23.6% Retracement Level calculated from the October 2002 low to
its early 2004 high. One of two things will probably develop once these
key support levels are reached. Either the Dow will find support in the
9900-10000 area and then undergo some type of rally due to oversold conditions
or it will break below 9900 and then undergo a more significant drop back to its
longer term 38.2% Retracement Level near 9400 (point A).
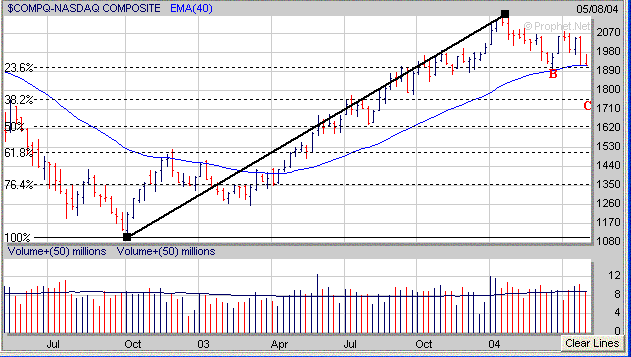
The Nasdaq currently has held
support near 1915 which is at its 40 Weekly EMA (blue line) and longer term
23.6% Retracement Level calculated from the October 2002 low to the early 2004
high. Another area of support to watch next week in the Nasdaq if it drops
below 1915 is at its late March low near 1900 (point B). One of two
scenario's are possible in the Nasdaq. Either the Nasdaq will hold support
near 1900 next week and eventually rally due to oversold conditions or it will
break below 1900 leading to a much bigger drop back to its longer term 38.2%
Retracement Level near 1760 (point C).
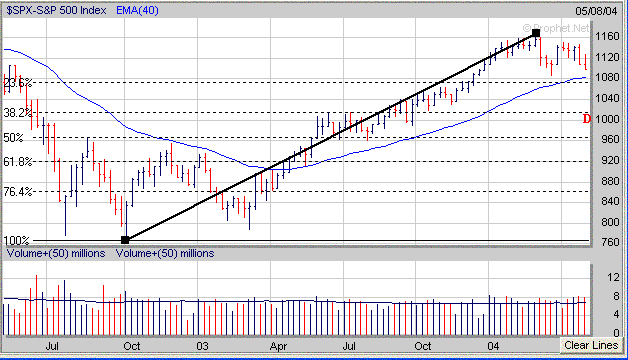
As far as the S&P 500 the key support levels to watch next
week are in the 1070 to 1090 range which coincide with its longer term 23.6%
Retracement Level (1070), 40 Weekly EMA (1080) and late March low near
1090. Just like the Dow and Nasdaq there are a couple of scenario's for
the S&P 500 as well. If the S&P 500 can hold support above 1070
then this may lead to an oversold rally but if it breaks below 1070 then look
for a much bigger drop back to its longer term 38.2% Retracement Level near 1015
(point D).
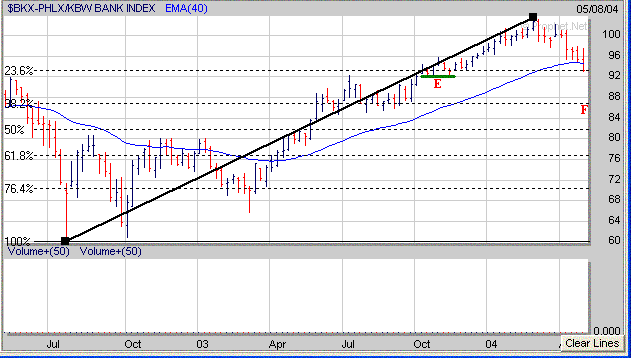
A few sectors to keep an eye on next week are the Banks and the
Semiconductors. The Banking Index (BKX) broke below its 40 Weekly EMA
(blue line) this week and closed on Friday near its longer term 23.6%
Retracement Level just above 93. A key level to watch next week in the BKX
is around 92 which was near the low made in the Fall of 2003 (point E). If
the BKX takes out the 92 level then its next level of downside support would
probably be near 87 which is at its longer term 38.2% Retracement Level (point
F). Remember the Banks are heavily weighted in the S&P 500 so it will
be critical for the BKX to hold support near 92 next week.
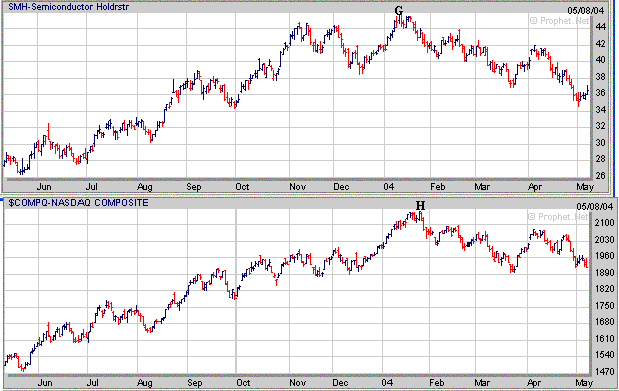
Meanwhile looking at the
Semiconductors the Semiconductor Holders (SMH) actually performed well this
week. Remember what happened earlier in the year when the SMH's topped out
in early Janaury (point G) while the Nasdaq peaked a week later (point H).
Notice this week the SMH's were rallying while the Nasdaq continued lower.
Thus it will be interesting to see if the recent strength in the SMH's is a
signal that that the Nasdaq is possibly nearing a bottom.
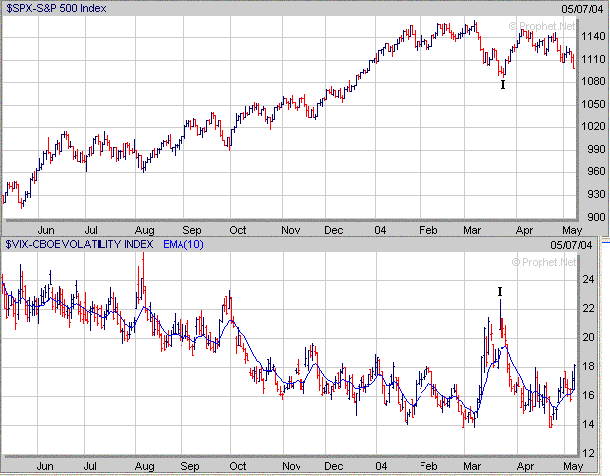
One thing I will be watching
closely next week is the action in the Volatility Index (VIX). What I
would like to see is a strong spike upward similar to what occurred in late
March when the VIX rose into the lower 20s (point I) and got stretched
significantly away from its 10 Day Moving Average (MA) which signaled a nearing
reversal. On Friday the VIX closed just above 18 so if it can rise above
20 next week hopefully this will be a sign of a nearing bottom followed by an
upside reversal.
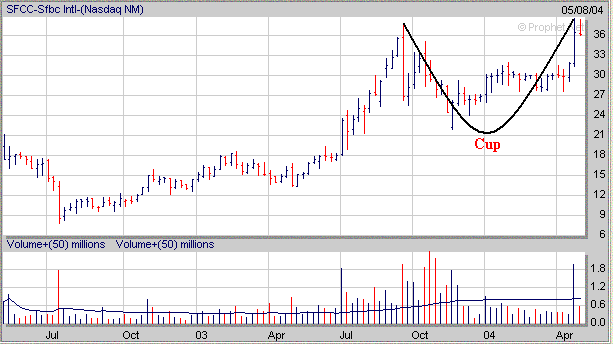
As mentioned last weekend when
the market is correcting that is the the time to really start noticing which
stocks are holding up well and developing a favorable chart pattern. What
you should be looking for now are those stocks which have developed the right
side of a Cup. For example as pointed out last weekend SFCC has formed the
right side of a 7 month Cup and now needs to develop a constructive Handle over
the next few weeks to complete a "Cup and Handle"
pattern.
How can a Premium Membership to amateur-investor.net
benefit you as an investor? We focus on stocks which are exhibiting
favorable Sales and Earnings Growth that have developed a favorable chart pattern such as a
"Cup and Handle",
"Double Bottom", "Flat Base" or "Symmetrical
Triangle". These stocks are then
included in our "Stocks to Watch List" which gives investors a
quick reference to those stocks which may provide the best buying opportunities
to the long side in the weeks ahead. Each stock in
our "Stocks to Watch List"
includes specific Buy Prices, Stop Loss Prices (very important) and projected
Target Prices. Signup
Today for a "Free" Trial Membership
and see which Stocks to Buy or Short in the weeks ahead
Amateur-Investor.net
|

