|
Signup
today for a Free 2 Week Trial Membership
which includes our Stocks to Watch List and Daily Breakout Reports
Weekend Stock Market Analysis
(11/13/04)
The major averages continue to rally due to weakness in the
price of Crude Oil. As I have mentioned several times the price of Crude
Oil and the Dow have been going in opposite directions during the past
year. When the price of Crude Oil has risen (points A to B) the Dow drops
(points C to D) and when the price of Crude Oil has fallen (points B to A) the
Dow has risen (points D to C). The question at this
point is has the price of Crude Oil made a significant top or is the recent
action just another pullback before it eventually tries to rally to a new 52
week high in the weeks ahead? 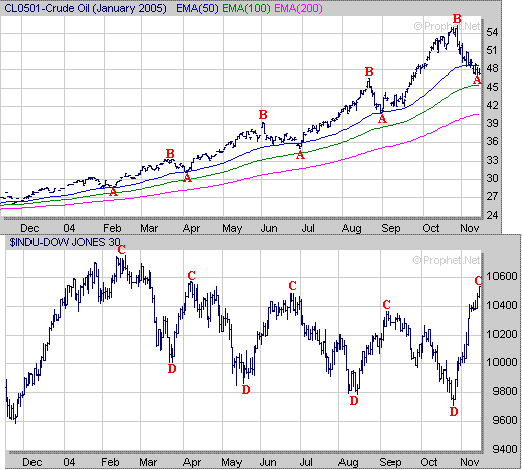 One thing I have been noticing over
the past 5 weeks is that the Oil Index (XOI) which tracks the Oil related stocks
has been holding support near its 10 Weekly EMA (blue line) while developing a
trading range (TR) between 685 and 730. Eventually the XOI is going to
break out of this trading range which may have an impact on the market. If
the XOI breaks above 730 this could lead to higher Oil prices which may have a
negative affect on the major averages. Meanwhile if the XOI breaks below
the 685 level this could have a positive impact on the major
averages. 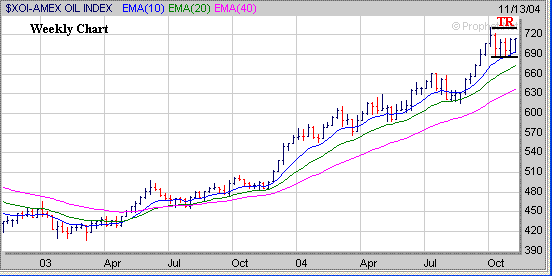
Despite the major averages rallying
strongly over the past 3 weeks one thing that is a little bothersome is the
rapid drop in the Volatility Index (VIX) which has dropped back to its early October
low (point E) this past week. This could mean that we may see a pullback
develop in the major averages before much longer so this
is something to be aware of in the days ahead. 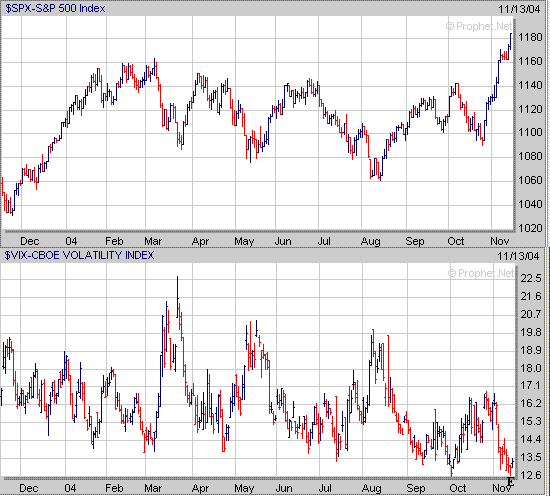
As far as the major averages
the Dow has finally broken its longer term trend of making lower highs as it has
risen well above its downward sloping trend line (solid black line) originating
from the February high. It looks like the Dow will probably rally back to
its February high near 10750 (point F) at some point before the end of the year. However
the question is will we first see a pullback develop before this happens or will
the Dow just continue to rally upward through the end of the month. If a
pullback does develop I would look for the first area of support at the Dow's
rising 10 Day EMA (blue line) which is currently approaching the 10350
area. 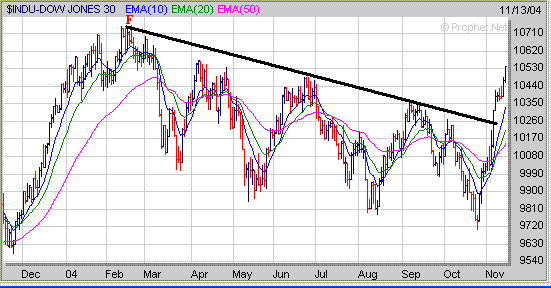
The Nasdaq has also rallied well
above its downward sloping trend line (solid black line) originating from its
January high. The Nasdaq will probably rally back to its January high near
2155 (point G) before the end of the year but we could see a pullback occur
before that happens. If a pullback does develop in the Nasdaq the first
area of support would be at its rising 10 Day EMA (blue line) which is
approaching the 2040 area. 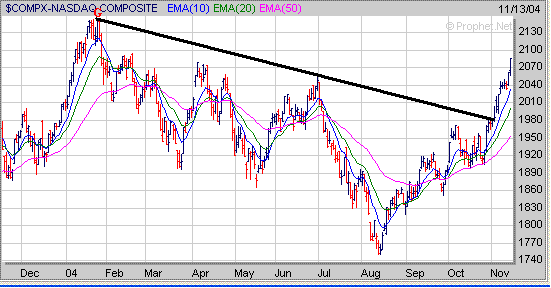
As for the S&P 500 it has broken
above a key longer term upside resistance area near 1160 which coincided with
its 50% Extension Level (calculated from the early 2000 high to the October 2002
low). If the S&P 500 continues higher through the end of the year its
next major upside resistance area is around 1255 which is at its 61.8% Extension
Level (point H). 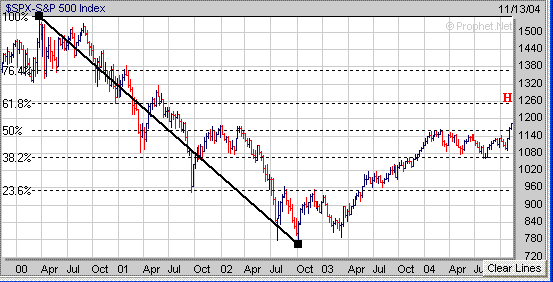
Meanwhile in the near term if we do
see a pullback develop in the S&P 500 I would look for initial support at
its rising 10 Day EMA (blue line) near 1160. 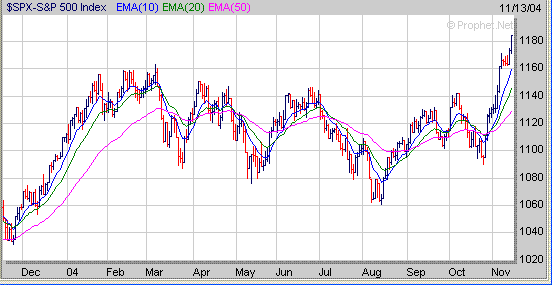
Finally
when looking for stocks to invest in focus on those stocks which have developed
a "Cup and Handle" pattern. DRIV is a recent example of a stock
which broke out of a small 3 week Handle (H) after forming a 5 month Cup. 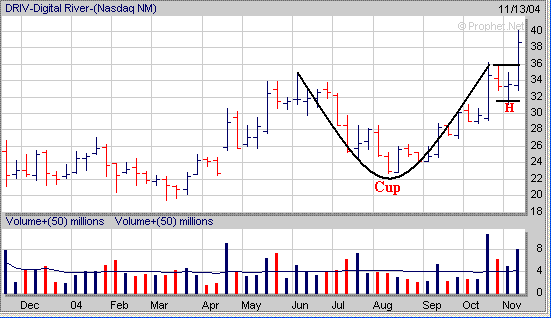
Signup today for a 2
Week Trial Membership and have access to our Stocks
to Watch List which provides a list of Stocks that are exhibiting a favorable Chart
Pattern such as the "Cup and Handle". Also you will receive our Daily Breakout Report
by email which Alerts you to Stocks
that are breaking out of a favorable Chart Pattern from our Stocks
to Watch List.
Click
Here to signup for a "Free" 2 Week Trial Membership
Amateur-Investor.net
|


