|
Weekend Stock Market Analysis
(11/19/05)
The major averages have now had four solid up weeks in a row
since the mid October bottom. However investors are quickly become
complacent as the Volatility Index (VXO) has dropped considerably since mid
October (points A to B). In the past when the VXO has dropped strongly
(points C to D) we have seen some type of correction/pullback occur (points E to
F). Since we are in a seasonally strong period for the market I believe
that any pullback that does develop will only last a short period of time (a few
weeks) which will then be followed by more upside as we end the year. Thus
we may see a similar pattern like occurred last June when the S&P 500 pulled
back for a few weeks (points G top H) but then rallied strongly in the month of
July (points H to
I). 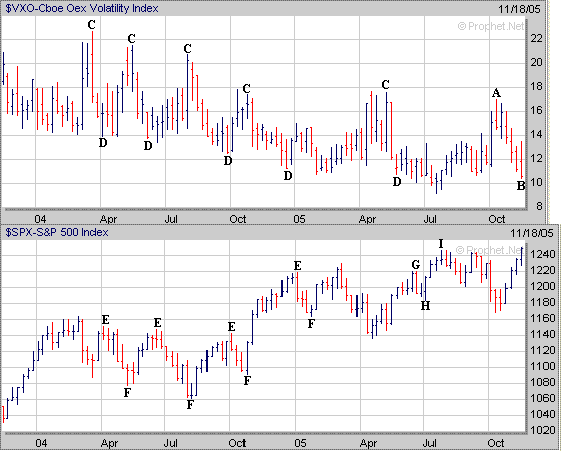
If a brief pullback does develop the
Dow should find support at or above its rising 20 Day EMA (blue line) just above
10570. 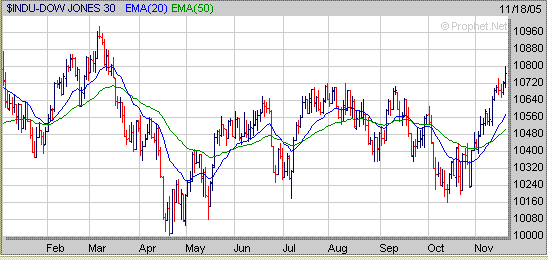 As
for the Nasdaq it should find support at or above its rising 20 Day EMA (blue
line) near 2170 if a pullback develops. 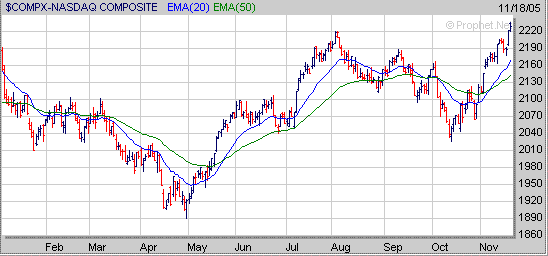
Meanwhile
the S&P 500 should find support at or above its rising 20 Day EMA near 1224
if a pullback does occur. 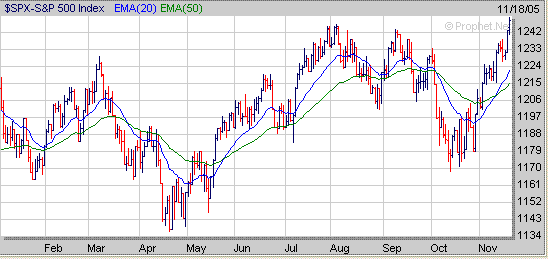
As
mentioned above if we do see a brief pullback develop I still think the major
averages will trend higher as we end the year especially if the price of Crude
Oil continues to drop. If we look at a longer term
chart of the Dow the next area of upside resistance would be at the March high
near 11000 (point J). If the Dow were able to break above 11000 then it
could eventually rally up to where it stalled out in 2001 near 11400 (point
K). 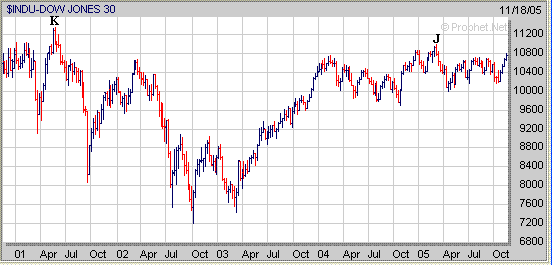
As for the Nasdaq it's currently
trying to break a previous resistance area just above 2200 (point L). If
the Nasdaq is able to trend higher through the end of the year its next area of
upside resistance appears to be around 2325 which is where it stalled out at in
May of 2001 (point M). 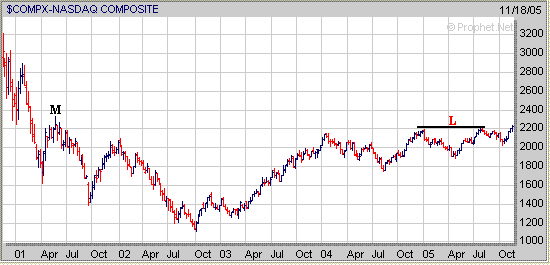
Meanwhile the S&P 500 still has a significant
longer term upside resistance area near 1254 (point N) which corresponds to its
61.8% Retracement Level (calculated from the early 2000 high to the October 2002
low). 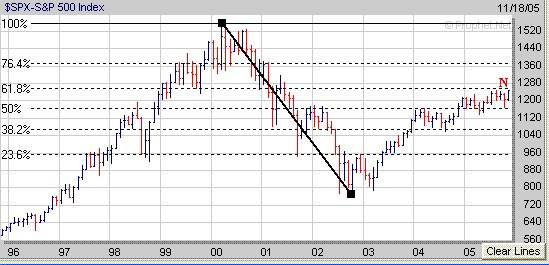
If the S&P 500 were
able to break above the 1254 level then it appears its next area of upside
resistance would be where it stalled out in May of 2001 just above 1300 (point
O). 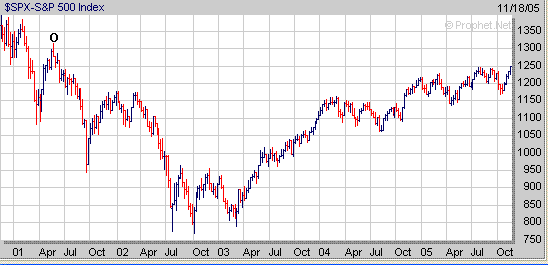
If the major averages continue to
rally through the end of the year focus on those stocks which are breaking out of a favorable chart pattern. During the past 9 months TESOF
has exhibited two favorable chart patterns. TESOF first developed a Cup
and Handle pattern from March through August and then broke out of its Handle
(H) in late August and rose from $13 to $17. Then over the next 9 weeks
TESOF traded nearly sideways and developed a Flat Base before breaking out again
this past week. 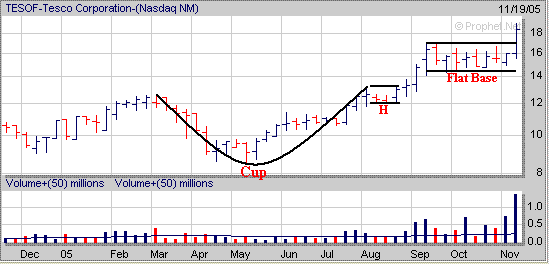
Quite often you will see this type
of pattern occur as a stock will initially break out of a Cup and Handle pattern
and rally for a period of time but then stall out and develop a Flat Base before
eventually resuming its up trend. Another example of this was shown by HP
as it developed a Double Bottom pattern with a Handle (H) in 2004 and then
rallied from November of 2004 through February of 2005 (points P to Q). Then HP stalled
out and traded nearly sideways from March through May and developed a 3 month
Flat Base before rallying strongly again from June through July (points S to T). 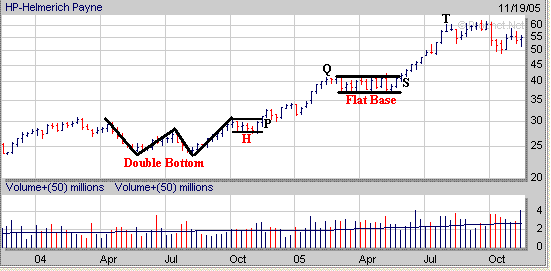
Signup today for a "Free"
2 Week Trial Membership to amateur-investor.net and have access to
our current Stocks to Watch Buy List which contains stocks that are currently developing a favorable chart
pattern as shown by the examples above.
Also you will have access to these other investment products.
Amateur Investor's Top 100 List
Short Term Investing Strategy
Daily Breakout Reports
Market Timing Indicator
Weekly ETF Buy and Sell Signals
Click
Here to Signup for a "Free" 2 Week Trial Membership
Amateur-Investor.net
|


