|
Signup
today for a Free 2 Week Trial Membership
which includes our Stocks to Watch List and Daily Breakout Reports
Weekend Stock Market Analysis
(11/20/04)
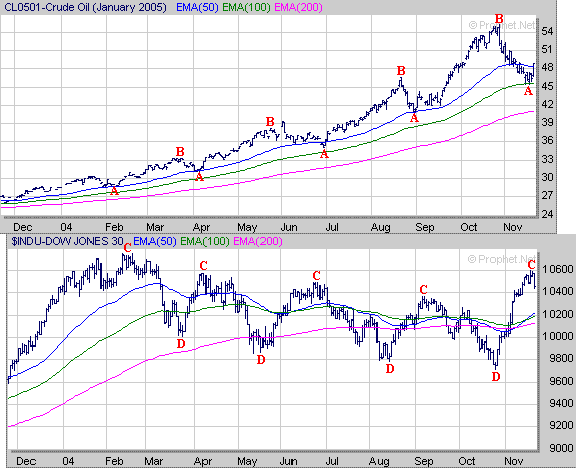
I believe the main thing to watch was we head into the end of the year is what
the price of Crude Oil does. As I have mentioned several times in the past
the price of Crude Oil and the Dow have been trading in opposite directions
during the past year. When the price of Crude Oil has risen (points A to
B) the Dow has trended downward (points C to D) and when the price of Crude Oil
has fallen (points B to A) the Dow has rallied (points D to C). This
week Crude Oil found support at its 100 Day EMA (green line) just above 45 and
then rallied strongly on Friday and closed just above its 50 Day EMA (blue
line). The question is at this point will Crude Oil try and rally back to
its previous high in the mid 50's over the next several weeks or will it stall
out after a few days and then stabilize?
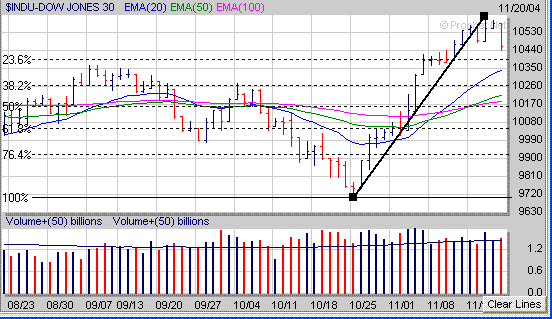
 As far as the major averages the Dow
rallied nearly 900 points from its late October low to the most recent
high. If we continue to see some selling pressure in the near term I
would look for initial support at its 20 Day EMA (blue line) near 10350.
If the Dow fails to hold support at its 20 Day EMA then the next area of support
would be in the 10180 to 10260 range which is where its 50 Day EMA (green line),
100 Day EMA (purple line) and 38.2% Retracement Level (calculated from the
October low to the most recent high) come into play.
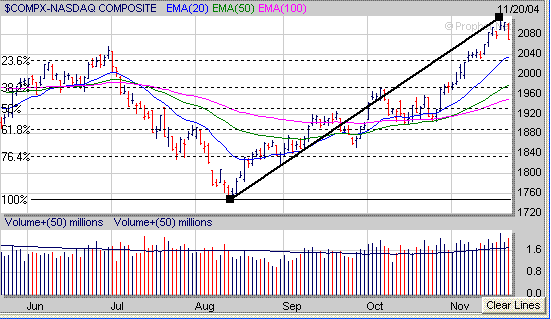
The Nasdaq has been in a persistent up trend since mid August and gained around
350 points during the past three months. In the near term if the Nasdaq
comes under some additional selling pressure I would look for initial support in
the 2025 to 2035 range which coincides with its 20 Day EMA (blue line) and 23.6%
Retracement Level (calculated from the August low to the most recent
high).
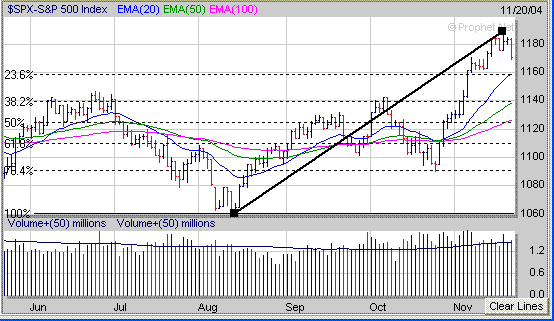
As far as the S&P 500 it has been in an up trend as well the past three
months and gained around 125 points. If we see some additional selling
pressure in the S&P 500 the first area of support would be around 1160 which
is where its 20 Day EMA (blue line) and 23.6% Retracement Level (calculated form
the August low to the most recent high) come into play at.
 As
mentioned in the beginning the price of Crude Oil will likely have a significant
impact on the major averages in the weeks ahead. If the price of Crude Oil
rallies over the next several weeks this will likely lead to more selling pressure in the major averages. Meanwhile if the recent action in the
price of Crude Oil is just a bounce from oversold conditions and it stalls out
after a few days, and then begins to trend lower in the weeks ahead, then this
would likely have a positive impact on the major averages into the end of the
year. One sector to watch is the
Oil Index (XOI) which has been consolidating over the past 6 weeks with a
trading range (TR) between 685 and 720. If the XOI breaks strongly out of
this trading range to the upside look for strength in the Oil stocks over the
next several weeks. 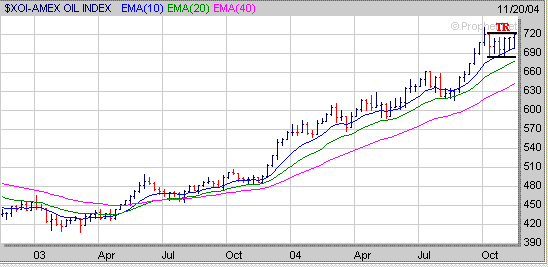
Over the past 6 weeks several of the
Oil related stocks have formed "Cup and Handle" patterns. An
example of one Oil stock is VPI which has developed a 6 week Handle (H) after
forming the right side of a 3 year Cup. If VPI can break above the $22
level then it could make a quick move up to around $26. 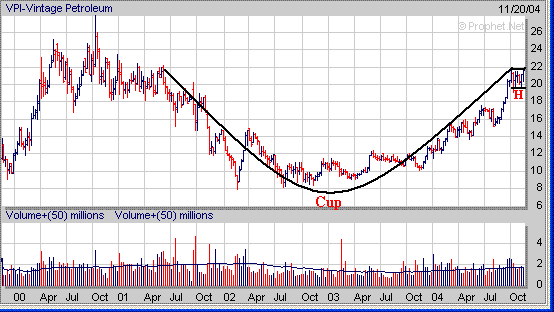
Signup today for a 2
Week Trial Membership and have access to our Stocks
to Watch List which provides a list of Stocks that are exhibiting a favorable Chart
Pattern such as the "Cup and Handle". Also you will receive our Daily Breakout Report
by email which Alerts you to Stocks
that are breaking out of a favorable Chart Pattern from our Stocks
to Watch List.
Click
Here to signup for a "Free" 2 Week Trial Membership
Amateur-Investor.net
|


