|
Weekend Stock Market Analysis
(11/26/05)
We have had 5 solid up weeks since the mid October low and all
three major averages are now on the positive side for the year. In the
near term the market is overbought and investors have become rather complacent
as the Volatility Index (VIX) is near its July low. As mentioned
last weekend I still believe we could see a brief pullback develop similar to
what occurred last June after the VIX dropped sharply (point A to B) which was
followed by a brief 2 week pullback in the S&P 500 (points C to D) before it resumed its
upward trend (points D to E). 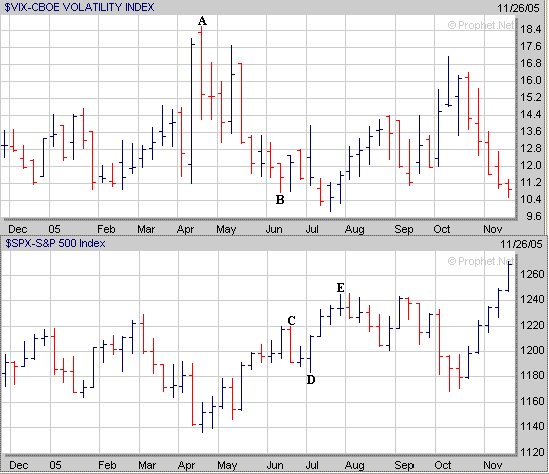
As far as the major averages the Dow has rallied around 800
points since the mid October bottom but may encounter some resistance at its
early March high near 11000 (point F). If the Dow does stall out near
11000 and eventually undergoes a brief pullback I would look for support at its
previous resistance area near 10700. 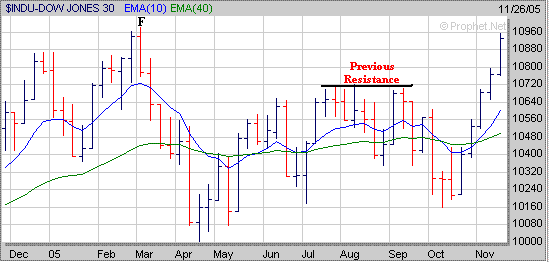
Meanwhile if the Dow does break strongly above the
11000 level then its next area of upside resistance would be around 11400 which
is where it stalled out at in 2001 (point G). 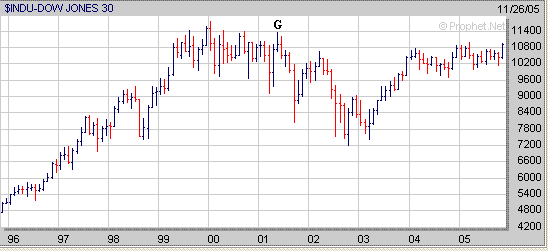
The Nasdaq has rallied over 200 points since the mid October
low. If the Nasdaq undergoes a brief pullback I would look for support
either at its early August high near 2220 (point H) or at its rising 20 Day EMA
(blue line) just above 2190. 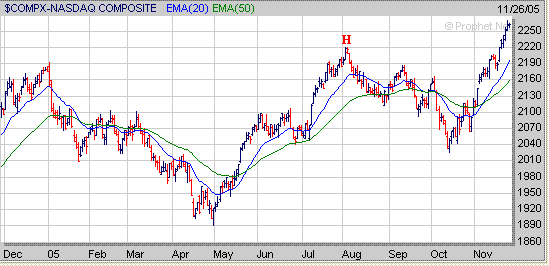 Meanwhile if the Nasdaq does continue higher through the end
of the year into the early part of 2006 its next area of upside resistance
may occur around 2330 (point I) which is where the bounce from oversold
conditions stalled out at in May of 2001. 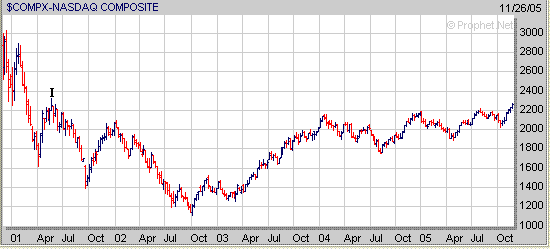
The S&P 500 has risen around 100 points since mid October
and if a brief pullback develops look for support either at its previous
resistance area near 1245 or at its rising 20 Day EMA (blue line) near
1235. 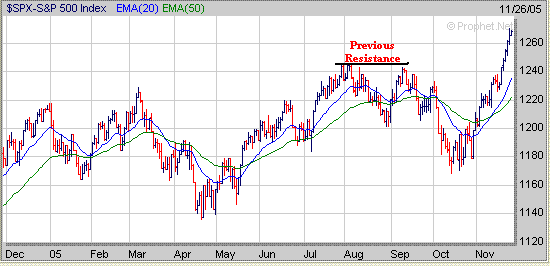
In the longer term the S&P 500 has
now risen just above a key
resistance area near 1254 which corresponds to its 61.8% Retracement
Level. If the S&P 500 continues higher through the end of the year
into the early part of 2006 its next level of upside resistance may occur
around 1315 (point J) which is where the bounce from oversold conditions stalled
out at in May of 2001. 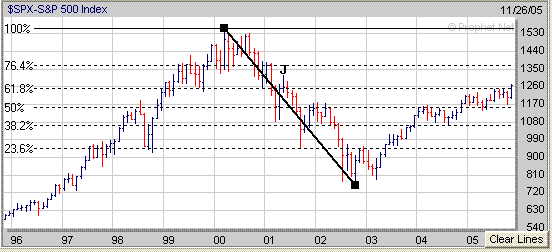
Meanwhile although I tend to focus on the Dow, Nasdaq and
S&P 500 when looking at the overall market the Russell 2000 looks rather
interesting. As you can see the Russell 2000 is exhibiting a similar
"Double Bottom" pattern like occurred earlier in the year and back in
2004. In the previous two cases after completing the "Double
Bottom" pattern the Russell 2000 then pulled back for a few weeks and
developed a Handle (H) before moving higher (points K to L). Thus if we see a similar
pattern occur again I would expect the Russell 2000 to pullback for a few weeks
before eventually moving higher as we end the year. 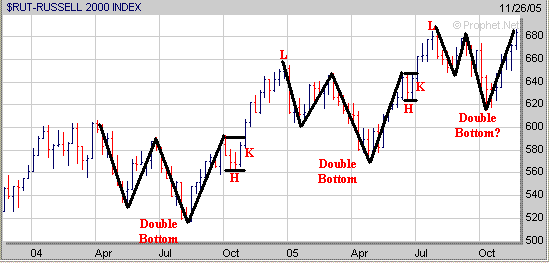
Finally if the major averages can continue higher through the end of the year
and into the early part of 2006 continue to focus on those stocks which are
breaking out of a favorable chart pattern.
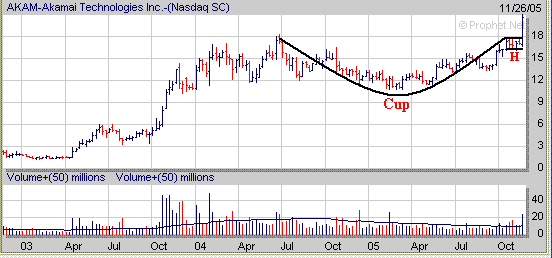
Last week AKAM a stock in our watch list broke strongly out of its 4 week Handle
(H) after forming a Cup.
 For the year our Long Term
Investing Strategy is up 31.4% while our Short Term Investing
Strategy is up 62%.
Signup today for a "Free"
2 Week Trial Membership to amateur-investor.net and have access to
our current Stocks to Watch Buy List which contains stocks that are currently developing a favorable chart
pattern which can be used with either our Long Term
Investing Strategy or Short Term Investing
Strategy.
Also you will have access to these other investment products.
Daily Breakout Reports
Market Timing Indicator
Weekly ETF Buy and Sell Signals
Click
Here to Signup for a "Free" 2 Week Trial Membership
Amateur-Investor.net
|

