|
Signup
today for a Premium Membership and save 50%
which includes our Stocks to Watch List and Daily Breakout Reports
Weekend Stock Market Analysis
(11/27/04)
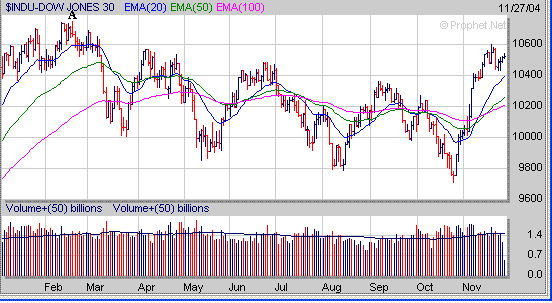
In the near term the Dow has held up well after rallying nearly
900 points from its late October low and has held support above its 20 Day EMA
(blue line) which is now near 10400. If the Dow can break above some minor
upside resistance near 10600 then it should be able to rally back to its
February high near 10750 (point A). Meanwhile if the Dow comes under some
selling pressure look for initial support at its 20 Day EMA near
10400. If the Dow drops below its
20 Day EMA near 10400 then its next level of support would be in the 10200 to
10250 range which corresponds to its 50 Day EMA (green line) and 100 Day EMA
(purple line).
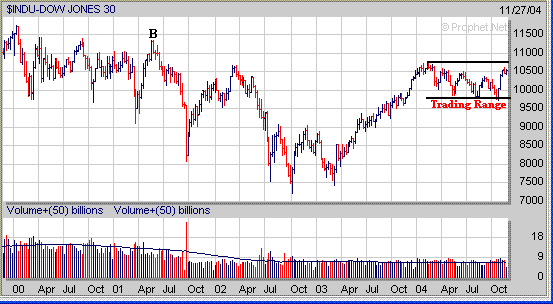
In the longer term the Dow still remains in a trading range between last February's
high and its October low. If the Dow can break above the top of its trading
range at 10750 then it appears its next area of upside resistance would be at
its 2001 high near 11300 (point B).
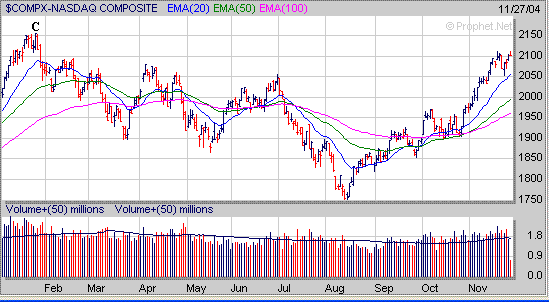
 The Nasdaq has been in an up trend
since its mid August low near 1750 and so far has held support near its 20 Day
EMA which is currently around 2050. If the Nasdaq continues to rise in the
near term look for its next area of upside resistance at its January high near
2150 (point C). Meanwhile if some selling pressure develops in the Nasdaq
look for initial support at its 20 Day EMA near 2050. If the Nasdaq drops
below 2050 then its next area of support would be at its 50 Day EMA (green line)
near 2000.
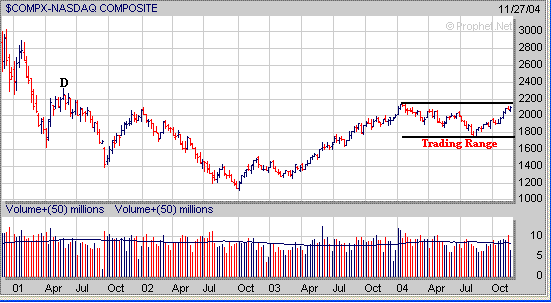
In the longer term the Nasdaq still remains in a trading range between last
January's high and the low made in August. If the Nasdaq can break above
the top of its trading range around 2150 then its next area of upside resistance
in the longer term would probably be at the high made in May of 2001 near 2300
(point D).
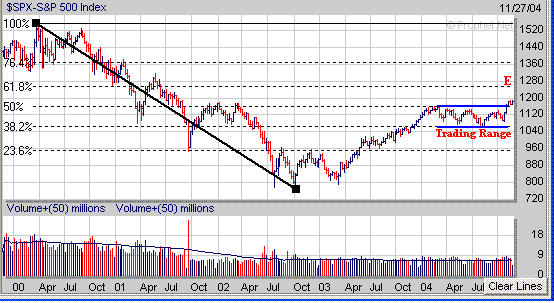
As far as the S&P 500 it also had been in a trading range between the high
made last March and the low that occurred in August which corresponded to its
longer term 38.2% and 50% Extension Levels calculated from the early 2000 high
to the October 2002 low. However over the past three weeks the S&P 500
has been attempting to breakout of its longer term trading range and if it does
follow through to the upside the next significant area of upside resistance
would be near 1255 which is at its 61.8% Extension Level (point E).
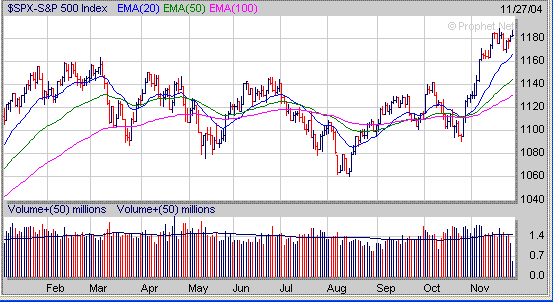
Meanwhile in the near term if the S&P 500 comes under some selling pressure
look for initial support at its 20 Day EMA which is currently around 1165.
If the S&P 500 drops below 1165 then its next area of support would be at
its 50 Day EMA (green line) near 1143.
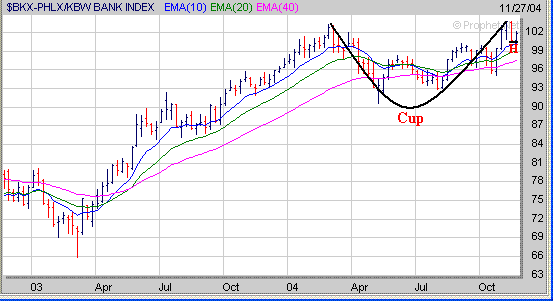
 As
far as a few sectors the Banking Sector (BKX) appears to have formed a Cup and
is now beginning to develop a small 2 week Handle (H). If the BKX can
break above the 104 level in the weeks ahead this would have a positive affect
on the S&P 500 which is heavily weighted by the Banks.
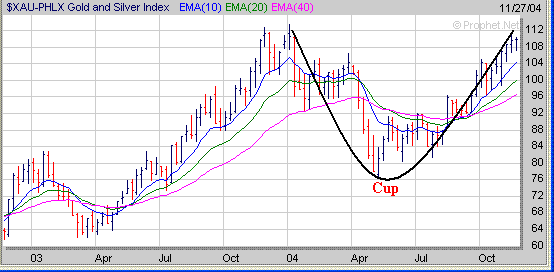
The Gold and Silver sector (XAU) appears to have formed the right side of a
Cup over the past 11 months and now needs to develop a constructive Handle while holding support at its 10 Weekly EMA (blue line) near
104.
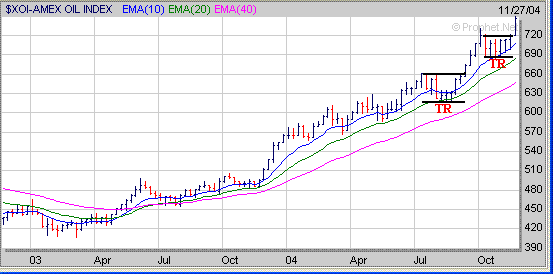
Meanwhile the Oil sector (XOI) has broken strongly out of its 6 week trading
range (TR) and has made a new 52 week high. A similar pattern occurred
last September as the XOI broke out of an 8 week trading range (TR) and then
rallied strongly for 4 weeks. If the XOI continues to show strength in the weeks ahead then the Oil related
stocks will continue to do well.
 When searching for stocks to
possibly invest in look for those exhibiting a favorable chart pattern such as
the "Cup and Handle" pattern. Last weekend I mentioned VPI as an
Oil stock to watch if the Oil sector broke out of its trading range to the
upside. As you can see below VPI had developed a "Cup and
Handle" pattern prior to breaking out this week. 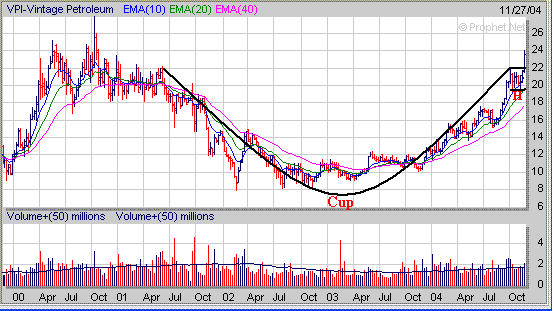
Signup today for a 2
Week Trial Membership and have access to our Stocks
to Watch List which provides a list of Stocks that are exhibiting a favorable Chart
Pattern such as the "Cup and Handle". Also you will receive our Daily Breakout Report
by email which Alerts you to Stocks
that are breaking out of a favorable Chart Pattern from our Stocks
to Watch List.
Click
Here to signup for a "Free" 2 Week Trial Membership
Amateur-Investor.net
|


