|
Weekend Stock Market Analysis
(11/5/05)
The major averages continued to follow through this week especially
the Nasdaq and S&P 500 after making a bottom in mid October. Looking
at the 5 Day Average of the Put to Call Ratio shows investors were convinced the
market was going lower as it rose well above 1.0 back in mid October (point
A). As we have seen in the past when the 5 Day Average of the Put to Call
Ratio has risen well above 1.0 (points B) this has led to some decent rallies
(points C to D). The question at this point is low long will this
rally maintain itself? Will it last for several weeks like we saw from
late April through July of this year (solid brown line) or will it be of shorter
duration like occurred in the early Summer of 2004 (solid red
line)? 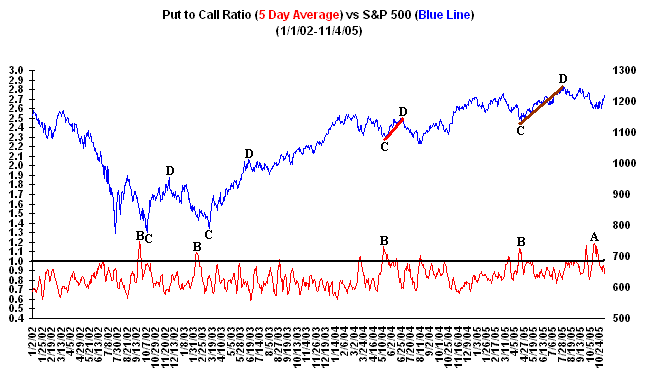
As far as the major averages the Dow
has rallied around 350 points since making a bottom in mid October. As
long as the Dow can hold support at or above its 50 Day EMA (blue line) near
10420 then the rally from its October low should continue. The next major
upside resistance area for the Dow appears to be around 10700 which is where it
encountered resistance at in July, August and September. 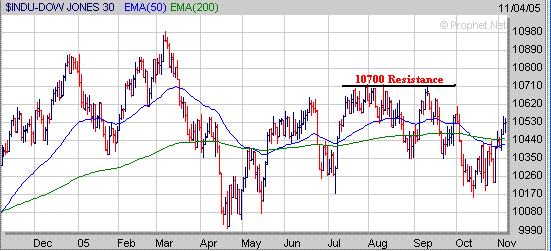
The Nasdaq has rallied over 140
points since mid October and has risen well above its 50 Day EMA (blue
line). As long as the Nasdaq can hold support above its 50 Day EMA which
is currently around 2115 on any pullback then its rally from the October low
should continue. If the Nasdaq continues to rise next week I suspect we
may see some resistance develop around 2190 which is where it stalled out at in
September (point E). In the longer term if the Nasdaq is able to rise
above the 2190 level then I would expect it to rise back to or slightly above
its early August high near 2220 (point F) by the end of the year. 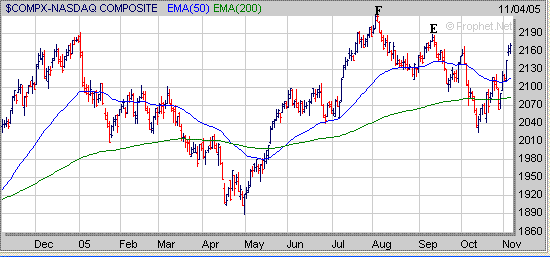
Meanwhile the S&P 500 has risen
around 50 points since mid October and also is above its 50 Day EMA as well
(blue line). As long as the S&P 500 can hold support above its 50 Day
EMA near 1205 on any pullback then the rally from its October low should
continue. If the S&P 500 does rally into the end of the year I would
expect it to rise back to around the 1245 level which is where it encountered
resistance at in August and September. 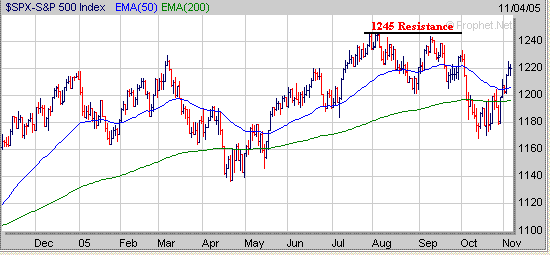
I still think we will have to watch
the price of Crude Oil in the weeks ahead as this could have a negative
or positive impact on the market as we end the year and move into 2006.
The long term chart of Crude Oil shows it has been in a steady up trend since
late 2003 and has been recently holding support above its 40 Weekly EMA (green line). 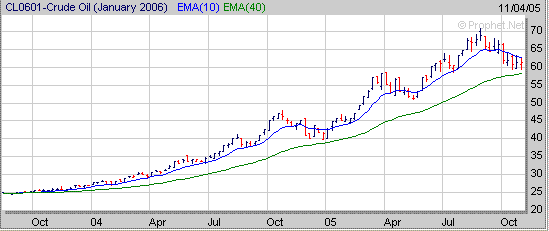
Also
if we take a look at the longer term charts of the Dow and Nasdaq both of them
basically peaked in early 2004 and have been stuck in a choppy trading range
for nearly two years as the price of Crude Oil has been steadily going higher
since late 2003. 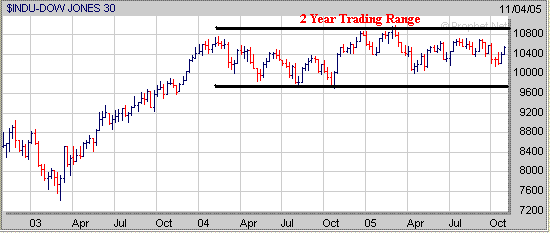 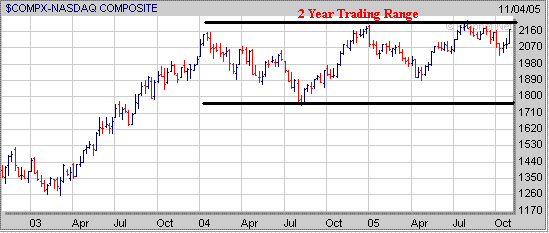
This is why I think the price of
Crude Oil needs to be watched closely over the next several weeks. If the
price of Crude Oil eventually breaks strongly above its 10 Weekly EMA and makes
another substantial move upward as we move into 2006 this will likely have a
negative affect on the major averages for the longer term. However if the
price of Crude Oil breaks strongly below its 40 Weekly EMA as we move into 2006
then this would likely have a positive affect on the major averages for the
longer term.
Finally
if we do see the major averages rally through the end of the year continue to
search for those stocks that are forming a favorable chart pattern. A
couple of stocks I'm watching are MRGE and THOR. MRGE has formed
a Double Bottom pattern and will need to develop a constructive Handle over the
next few weeks. 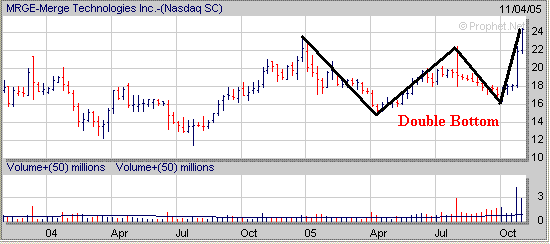
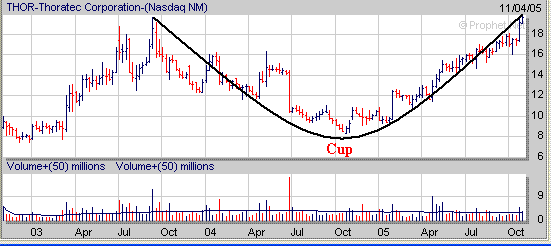
Meanwhile THOR has completed the
right side of a 1 Year Cup and also needs to develop a constructive Handle
during the next few weeks.
Signup today for a "Free"
2 Week Trial Membership to amateur-investor.net and have access to
our current Stocks to Watch List which contains stocks that are currently developing a favorable chart
pattern in addition to MRGE and THOR as mentioned above.
Also you will have access to these other investment products.
Amateur Investor's Top 100 List
Short Term Investing Strategy
Daily Breakout Reports
Market Timing Indicator
Weekly ETF Buy and Sell Signals
Click
Here to Signup for a "Free" 2 Week Trial Membership
Amateur-Investor.net
|

