|
Signup
today for a Free 2 Week Trial Membership
which includes our Stocks to Watch List and Daily Breakout Reports
Weekend Stock Market Analysis
(11/6/04)
Although a quick outcome to the election may have helped the market I still
think the bigger reason for the strong rally over the past few weeks was due to
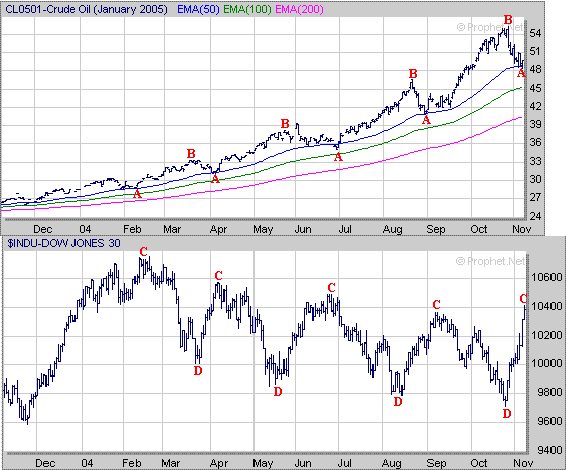
the drop in Oil Prices. As shown below the Dow and the price of Crude Oil
have gone in opposite directions during the past year. Basically when the
price of Oil has rallied (points A to B) the Dow has dropped (points C to D) and
when the price of Oil has dropped (points B to A) the Dow has risen (points D to
C).
Also as I have pointed out in the past the price of crude Oil has been
finding support near its 50 Day EMA (blue line) during the past year while
remaining in an upward trend. Currently the price of Crude Oil has dropped
back to its 50 Day EMA once again and the question is what will happen now?
One of two scenarios will probably develop in the weeks ahead. The first
scenario would be for the price of Crude Oil to hold support near its 50 Day EMA
and then eventually rally to new highs while maintaining its upward bias which
would likely cause selling pressure to redevelop in the major
averages. Meanwhile the second scenario would be for the price of
Crude Oil to break below its 50 Day EMA and then drop back to its 100 Day EMA
(green line) near $45 which would likely allow for more upside movement in the
major averages.
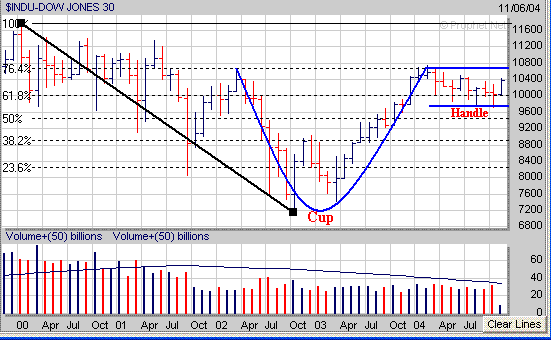
As far as the major averages on a longer term basis the Dow
still appears to be exhibiting a potential "Cup and Handle"
pattern. If the Dow attempts to rally through year end I would imagine it
will encounter significant upside resistance near the top of its Handle around
10750 which also coincides with its 76.4% Extension Level (calculated from the
early 2000 high to the October 2002 low).
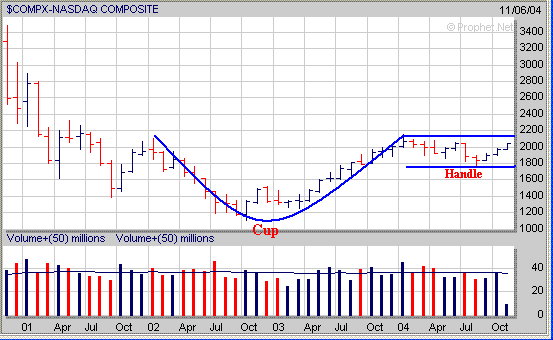
The Nasdaq also appears to be exhibiting a longer term "Cup
and Handle" pattern as well. If the Nasdaq attempts to rally through
the end of the year I would expect it to encounter significant upside resistance
at the top of its Handle near 2150.
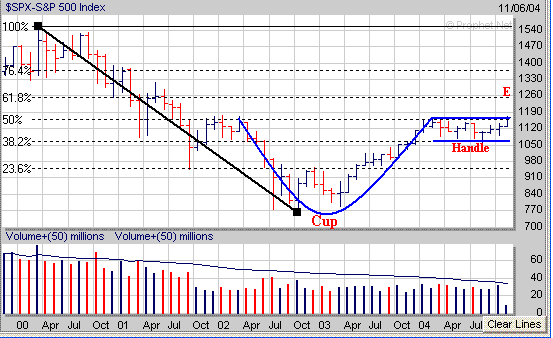
Meanwhile the S&P 500 which has also been exhibiting a
"Cup and Handle pattern has rallied back to the top of its Handle. If
the S&P 500 maintains an upward bias through the end of the year its next
significant area of upside resistance would be near 1260 (point E) which is at
its 61.8% Extension Level calculated from the 2000 high to the 2002 low.
Although the market has rallied strongly the past few weeks it
has become somewhat overbought and could be due for a pullback at anytime.
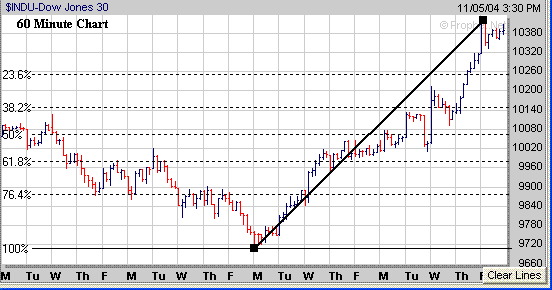
The Dow has gained nearly 700 points in two weeks and if some type of pullback
develops I would look for initial support around 10250 which coincides with the
Dow's 23.6% Retracement Level (calculated from the November 1st low to the
recent high).
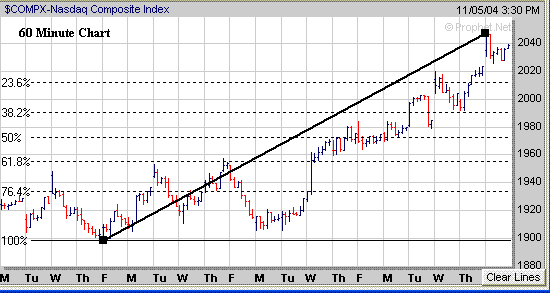
As for the Nasdaq it has gained around 150 points over the past
three weeks and if it pulls back some I would look for initial support at its
23.6% Retracement Level near 2015.
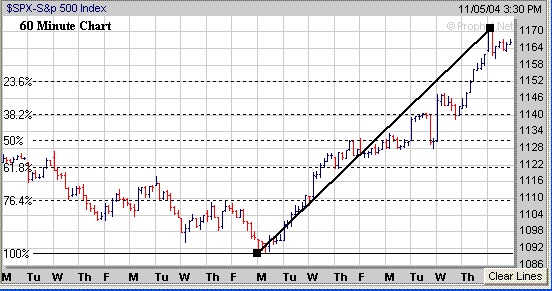
The S&P 500 has gained around 80 points the past two weeks
and if we see a pullback develop I would look for initial support at its 23.6%
Retracement Level near 1152.
As mentioned in the beginning what happens with the price of
Crude Oil will likely have an impact on the major averages in the weeks ahead. If
the price of Crude Oil holds support near its 50 Day EMA in the upper $40's and
then begins to rally back into the mid 50's this will probably lead to the
redevelopment of selling pressure in the major averages. However if the
price of Crude Oil breaks below its 50 Day EMA, leading to a drop back to its 100
Day EMA in the mid 40's, this would likely help the major averages move
higher.
If the major averages can perform well going into the end of the
year continue to focus on those stocks which have good Sales and Earnings Growth
that are developing a favorable chart pattern such as the "Cup and
Handle". A recent example from our Top 100 Stocks List shows
during the past 5 months ALDN has formed the right side of a Cup and now needs
to develop a constructive Handle over the next few weeks to complete its
"Cup and Handle" pattern. 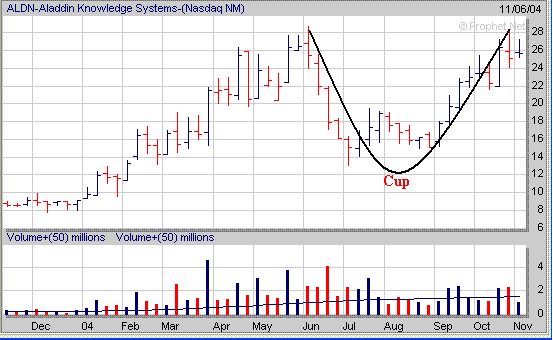
Signup today for a 2
Week Trial Membership and have access to our Stocks
to Watch List which provides a list of Stocks that are exhibiting
favorable Chart Patterns. Also you will receive our Daily Breakout Report
by email which Alerts you to Stocks
that are breaking out of a favorable Chart Pattern from our Stocks
to Watch List.
Click
Here to signup for a "Free" 2 Week Trial Membership
Amateur-Investor.net
|


