|
Weekend Stock Market Analysis
(10/15/05)
The major averages remained under selling pressure most of this
week but then attempted to bounce from oversold conditions on
Friday. One encouraging sign is the increase in
fear among investors as we have seen a rapid spike upward in the Volatility
Index (VIX) since mid September. 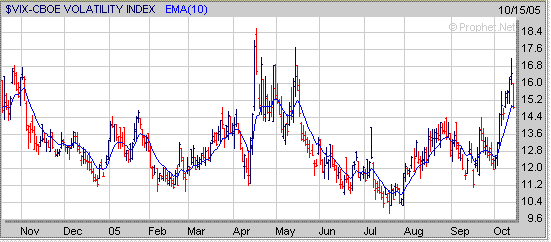
Meanwhile
the 5 Day Average of the Put to Call Ratio has risen well above a value of 1.0
(point A) for the second time in less than a month. In the past when the 5
Day Average of the Put to Call Ratio has risen well above 1.0 (points B) this
has eventually been followed by a decent rally within a few weeks (points C to
D). Thus it will be interesting to see if a decent rally eventually
develops before the end of October in the major averages. 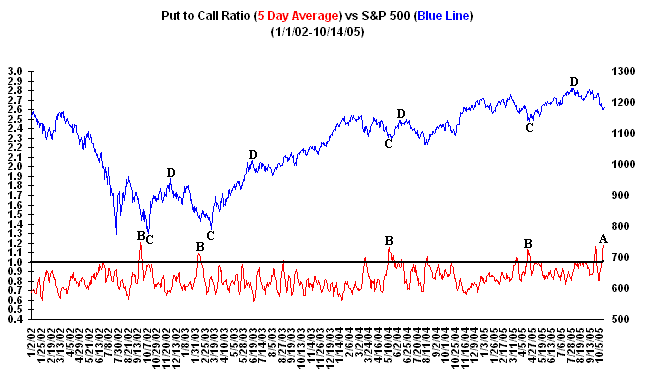
As far as the major averages the Dow
remains well below its 50 Day EMA (blue line) and 200 Day EMA (green line) but
did reverse to the upside on Friday. If the Dow does follow through to the
upside the first area of resistance would be near 10450 which is where its 50
Day EMA and 200 Day EMA reside at. Meanwhile if the Dow only bounces for a
few days and then comes under more selling pressure it has a key support area at
its April low near 10000 (point E). 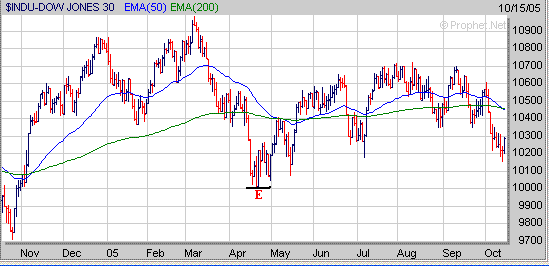
The Nasdaq began to reverse
its
downward trend on Thursday and followed through on Friday. In the near
term its first area of upside resistance would be at its 200 Day EMA (green
line) near 2080. If the Nasdaq is able to rise above its 200 Day EMA then
its next area of resistance would be at its 38.2% Retracement Level near
2100. Meanwhile if the Nasdaq stalls out early next week below its 200 Day
EMA and begins to come under more selling pressure I would look for support at
its 61.8% Retracement Level just above 2010. 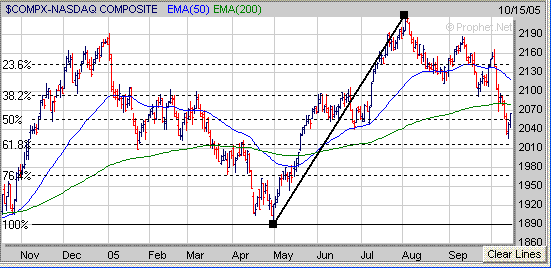
A
key sector to watch that will have an affect on the Nasdaq is the
Semiconductors. So far the Semiconductor Holders (SMH) have been able to
find support near 33.75 which is where they held support at last June (point
F). If the SMH's were to break solidly below the 33.75 level at some point
in the future then that could lead to a much bigger drop back to their April low
near 30 (point G) which would have a negative affect on the Nasdaq. Thus
it's going to be important for the SMH's to hold support near the 33.75 level in
the weeks ahead. 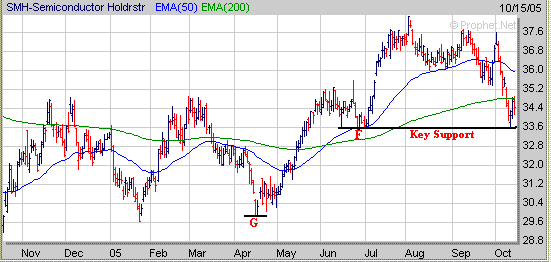
The S&P 500
also reversed its downward trend on Friday and its first area of upside
resistance would be at its 200 Day EMA (green line) near 1195. If the
S&P 500 can break above its 200 Day EMA then it could eventually rally up to
its 50 Day EMA (blue line) near 1210. Meanwhile if the S&P 500 stalls
out near its 200 Day EMA and then comes under more selling pressure then it
could eventually retest its April low near 1140 (point H). 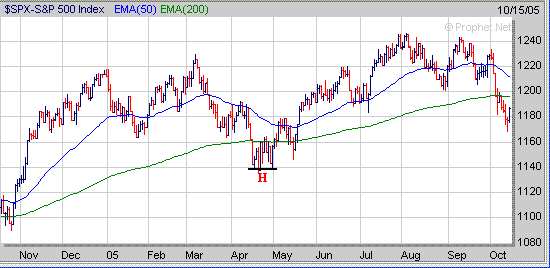
Finally although it's never pleasant
to see the market sell off it does give you the opportunity to look for those
stocks which are holding up well and developing a favorable chart pattern as
these stocks may become the next market leaders once the market makes a bottom
and reverses to the upside. As an example so far RHAT has been holding up
well since early September and over the past two weeks has developed a small
Handle (H) after forming a Cup. 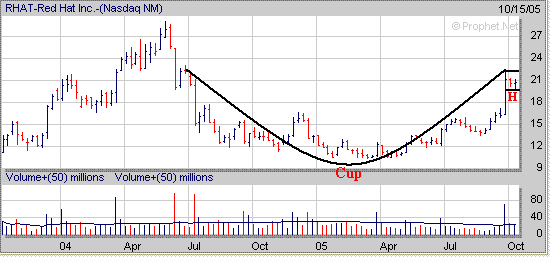
Signup today for a "Free"
2 Week Trial Membership to amateur-investor.net and have access to
our current Stocks to Watch List which contains stocks that are currently developing a favorable chart
pattern such as the Cup and Handle, Double Bottom or Flat Base.
Also you will have access to these other investment products.
Amateur Investor's Top 100 List
Daily Breakout Reports
Market Timing Indicator
Weekly ETF Buy and Sell Signals
Click
Here to Signup for a "Free" 2 Week Trial Membership
Amateur-Investor.net
|

