|
Signup
today for a Free 2 Week Trial Membership
which includes our Stocks to Watch List and Daily Breakout Reports
Weekend Stock Market Analysis
(10/16/04)
Over the past year the market has been very choppy as we have
seen significant moves in both directions while being in a persistent
downtrend. So far each significant upside turn in the market has been signaled
fairly well by following the Volatility Indexes which track the Nasdaq 100 (VXN)
and S&P 500 (VIX). As shown below when the Nasdaq
has sold off and begun to near a bottom the VXN has risen into the upper 20's
the past three times (points A). Currently the VXN has only risen into the
lower 20's (point B) while the Nasdaq has come under some selling
pressure during the past few weeks. 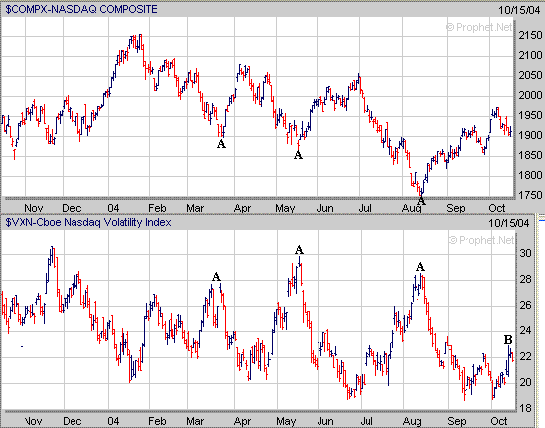
Meanwhile looking at the VIX during
the past year shows that it has risen to 20 or above (points C) when the S&P
500 has neared a significant bottom. Currently the VIX has only risen into
the mid teens (point D) as the S&P 500 has come under some selling pressure
over the past few weeks. 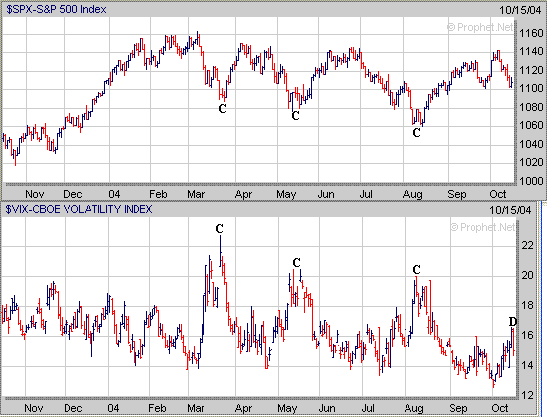
Although the major averages did try
to bounce on Friday so far neither the VXN or VIX have risen to levels yet that
would signal a major bottom is in place based on previous
readings. Meanwhile one thing that continues to
pressure the market is the rising price of Crude Oil. As I have pointed
out before during the past several months the price of Crude Oil and the Dow
have been going in opposite directions. When the price of Crude Oil rises
the Dow drops (points E to F) and when the price of Crude Oil drops the Dow
rises (points F to E). Thus it appears as long as the price of Crude
Oil continues to rise this will have an adverse affect on the market. However
I would also like to point out that the price of Crude Oil has risen during the
past 6 weeks and may be getting close to a pullback. Notice previous rises
in the price of Crude Oil have lasted around 6 weeks or so (early February
through mid March, early April through mid May, late June through mid August)
before a pullback occurred. 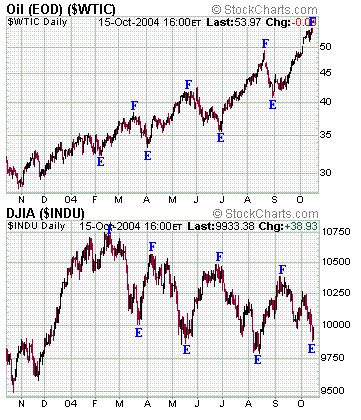
As far as the major averages the Dow
did bounce on Friday and if it attempts to rally for a few days I would look for
resistance to occur in the 10100 to 10150 area which is where its 200 Day EMA
(purple line), 100 Day EMA (green line) and 50 Day EMA (blue line) come into
play at. Meanwhile a key support area to watch over the next few weeks
resides near 9800 (point G) which was the Dow's low in August. 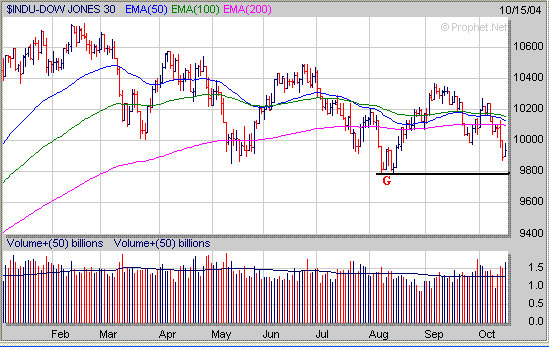
If the Dow breaks below 9800 this
could lead to a much larger drop back to its longer term 38.2%
Retracement Level (calculated from the October 2002 low to the February 2004
high) near 9400 (point H). 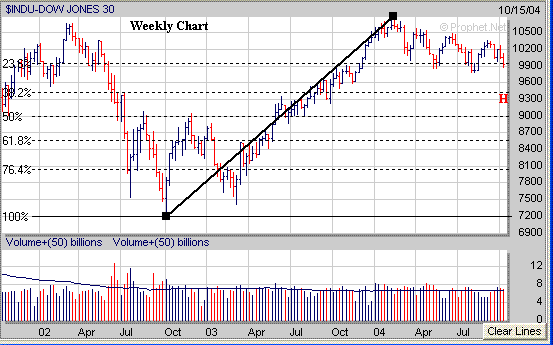
The Nasdaq held support on Friday at
its 50 Day EMA (blue line) near 1900. If the Nasdaq tries to rally for a
few days look for resistance just below 1960 which coincides with its 50%
Extension Level (calculated from the January high to the August low).
Meanwhile if the Nasdaq drops below 1900 then its next support area would be
just above 1840 (point I) which coincides with its 23.6% Extension Level. 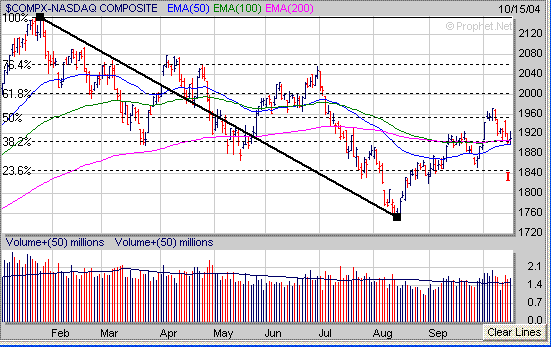
A key sector to watch which will
have an impact on the Nasdaq is the Semiconductors. The Semiconductor
Holders (SMH) have a key support area just below 28 which was at their September
low. 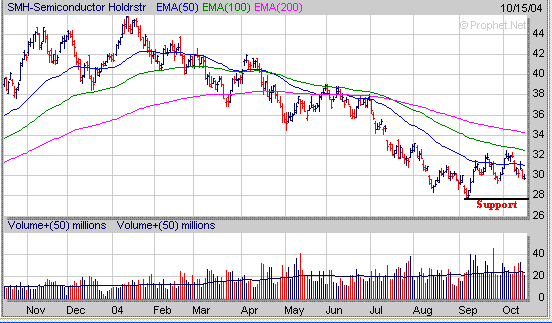
The 28 level is also a key longer
term support areas as well for the SMH's as this is near their 61.8% Retracement
Level (calculated from the October 2002 low to the January 2004 high). If
the SMH's break below 28 this would likely lead to a drop back to the 24 level
which coincides with their 76.4 Retracement Level. 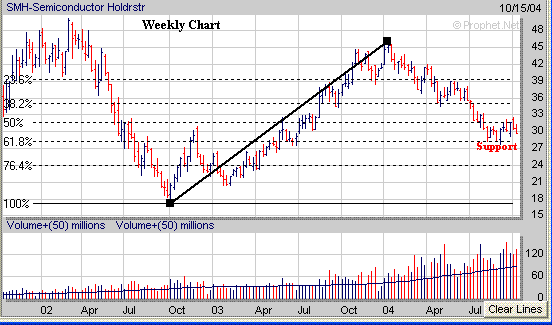
The S&P 500 held support on
Friday at its 200 Day EMA (purple line) near 1100. If it attempts to rally
for a few days I would look for resistance to occur near 1123 which coincides
with its 61.8% Extension Level (calculated from the March high to the August
low). Meanwhile if the S&P 500 drops below 1100 its next support level
would either be at its 23.6% Extension Level near 1085 (point J) or at its
August low near 1060 (point K). 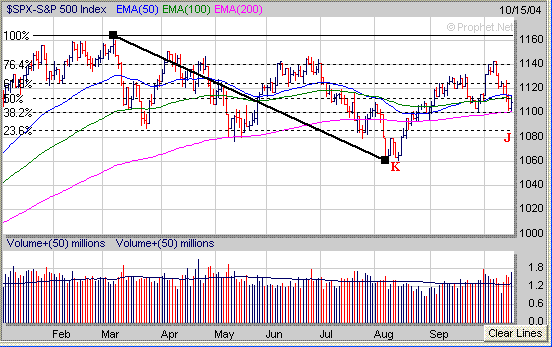
For those following the Gold and
Silver sector (XAU) the XAU found support this week at their 10 Weekly EMA (blue
line) just above 96 after rallying strongly the previous three weeks. If
the XAU can break above the 105 area this would likely lead to a move up to the
early January high near 113 (point L). Meanwhile if the XAU drops below 96 the
next area of support would be in the 93 to 94 range which coincides with its 20
Weekly EMA (green line) and 40 Weekly EMA (purple line). 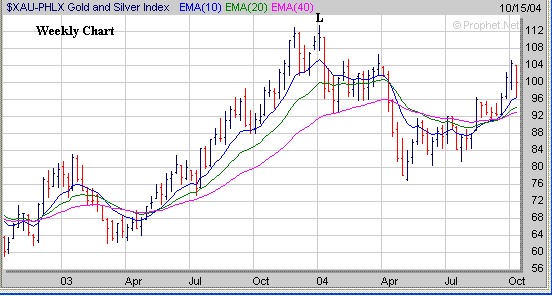
When the market is correcting make
sure to start jotting down a list of stocks which are developing a favorable
chart pattern like the "Cup and Handle" pattern. Remember the
first thing to notice are those stocks that are forming the right side of a Cup.
Cups can develop with differing time scales as shown by a couple of recent
examples from our latest Top 100 List. MHR has formed the right
side of a longer 3 1/2 year Cup and now needs to develop a constructive Handle
in the weeks ahead. 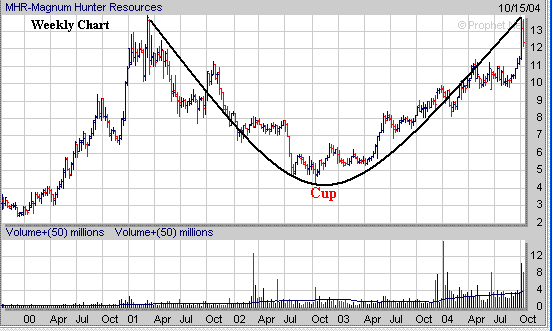
Meanwhile YHOO has formed the right
side of much smaller 4 month Cup and also needs to develop a constructive Handle
over the next few weeks as well. 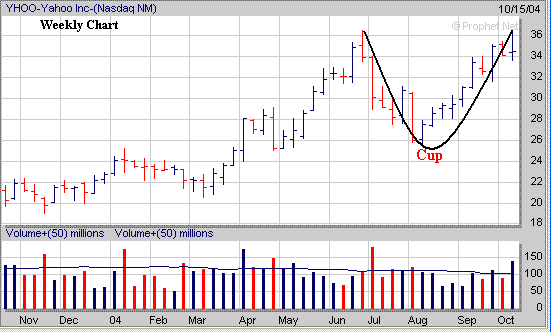
Signup today for a 2
Week Trial Membership and have access to our Market
Timing Indicator (MTI) and our Stocks
to Watch List which provides a list of Stocks that are exhibiting
favorable Chart Patterns along with specific Buy and Stop Loss Prices
in addition to Target Prices. For those that like to short
stocks we also a maintain a small list of potential stocks to short as well.
Also you will receive our Daily Breakout Report
by email which Alerts you to Stocks
that are breaking out of a favorable Chart Pattern from our Stocks
to Watch List.
Click
Here to signup for a "Free" 2 Week Trial Membership
Amateur-Investor.net
|


