|
Weekend Stock Market Analysis
(10/22/05)
It was a fairly volatile week for the market. The Dow which found support
the previous week near 10150 (point A) encountered resistance just below 10450
which is where its 10 Weekly EMA (blue line) and 40 Weekly EMA (green line)
resided at. At this point there are two possible scenario's for the Dow in
the upcoming weeks. The first scenario would be for the Dow to hold
support near 10150 and then eventually rise above the 10450 level leading to an
upward move back to the 10600 to 10700 range. Meanwhile the second
scenario would be for the Dow to break below the 10150 level leading to a drop
back to either its April low near 10000 (point B) or its October 2004 low near
9700 (point C). 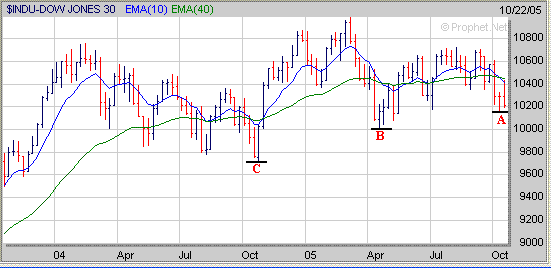
I still think the price of Crude Oil
may have an impact on the Dow although the most recent drop in price hasn't led
to a substantial rally in the Dow like occurred the previous two times. In
November and December of 2004 the price of Crude Oil sold off (points D to E)
and the Dow rallied over 1000 points. Meanwhile last April into May the
price of Crude Oil sold off (points F to G) and the Dow rallied around 600
points. Since late 2003 the price of Crude Oil has remained above
its 40 Weekly EMA (green line) as it has remained in an up trend.
Currently the 40 Weekly EMA is just above 57 so that will be a key level to
watch in the weeks ahead. At this point two things could happen to the
price of Crude Oil in the longer term depending on whether it holds support at
its 40 Weekly EMA or not. If the price of Crude Oil were to break solidly
below its 40 Weekly EMA then this could lead to an eventual drop back to its mid
May low near 51 (point G) which could have a positive affect on the Dow in the
longer term. However if the price of Crude Oil were to hold support at or
above its 40 Weekly EMA and then rally strongly then this could eventually lead
to higher Crude Oil prices like we saw from January through March (points E to
F) and from June through August (points G to H). If this were to happen
then this would likely have a negative affect on the Dow in the longer
term. 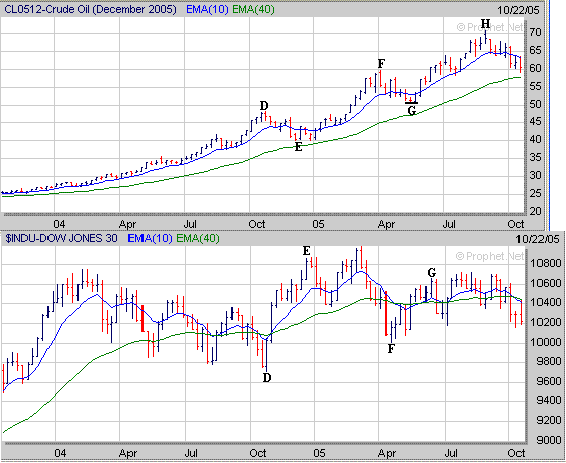
As far as the Nasdaq it
bounced this week after finding support in the near term around 2025 (point I)
the previous week. A key upside resistance area to watch in the near term
is around 2110 which corresponds to the Nasdaq's 10 Weekly EMA (blue
line). If the Nasdaq can rise above its 10 Weekly EMA then that would
likely lead to a more significant rally in the weeks ahead. However if the
Nasdaq were to stall out out near its 10 Weekly EMA and reverse direction then a
retest of the previous weeks low near 2025 would probably occur.
Furthermore if the Nasdaq were unable to hold support near 2025 then this
could eventually lead to a drop back to its 61.8% Retracement Level near 2010 or
its 76.4% Retracement Level near 1970. 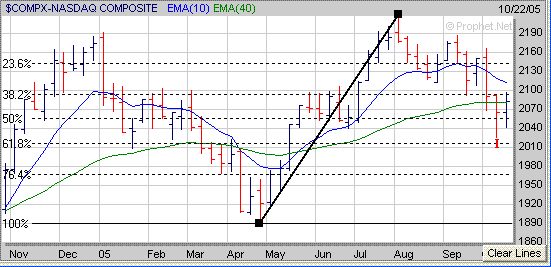
The S&P 500 so far has been
holding support near 1170 (point J) but encountered resistance this week at its
40 Weekly EMA (green line) just below 1200. At this point two things are
possible for the S&P 500 in the weeks ahead. If the S&P 500 can
hold support near 1170 and then rise above its 10 Weekly EMA just below 1210
then this could lead to an eventually rally up to the 1230 area. Meanwhile
if the S&P 500 breaks solidly below the 1170 area then this could lead to an
eventually drop back to its April low near 1140 (point K). 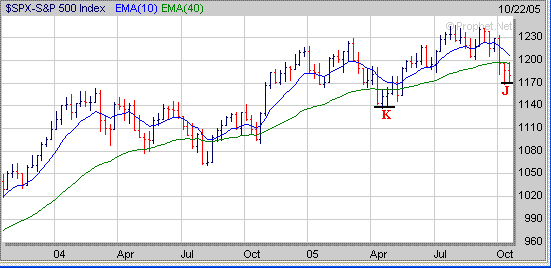
When the major averages aren't
acting well that is the time to start noticing which stocks are holding up the
best and forming a favorable chart pattern. Although many stocks have been
hit hard of late some have been holding up well. For example right now I'm
watching CRDN which has developed a small 2 week Handle (H) after forming a 10
month Cup. If the market begins to act better as we move into November and
December this may be a stock to keep an eye on since it has been holding up well
during the past few months.. 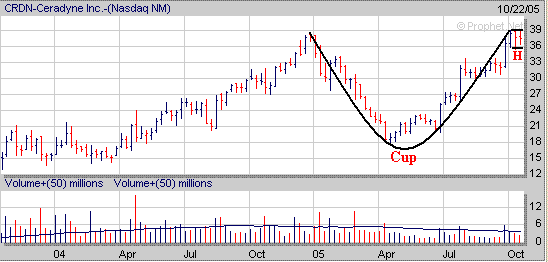
Signup today for a "Free"
2 Week Trial Membership to amateur-investor.net and have access to
our current Stocks to Watch List which contains stocks that are currently developing a favorable chart
pattern such as the Cup and Handle, Double Bottom or Flat Base.
Also you will have access to these other investment products.
Amateur Investor's Top 100 List
Daily Breakout Reports
Market Timing Indicator
Weekly ETF Buy and Sell Signals
Click
Here to Signup for a "Free" 2 Week Trial Membership
Amateur-Investor.net
|


