|
Signup
today for a Free 2 Week Trial Membership
which includes our Stocks to Watch List and Daily Breakout Reports
Weekend Stock Market Analysis
(10/23/04)
At this point it still appears the rising price of Crude Oil is
having the biggest affect on the market. As mentioned before during the
past year Crude Oil and the Dow have been trading in opposite directions such
that when the price of Oil rises the Dow sells off (points A to B) and when the
price of Oil drops the Dow rallies (points B to A). 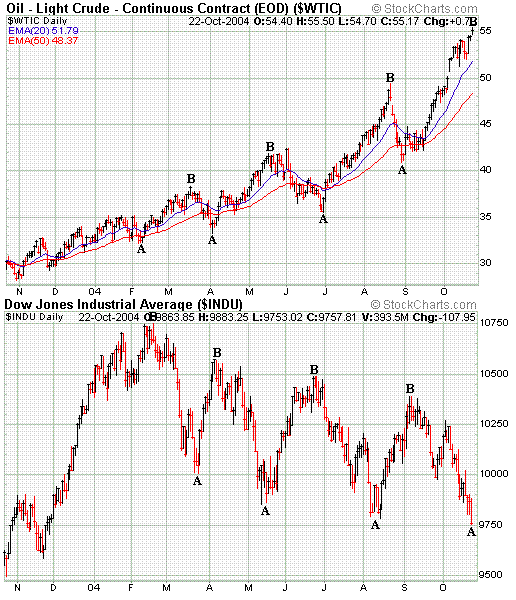
If this trend continues then the Dow
probably won't stage a rally until we see a drop in the price of Crude
Oil. One thing that I would like to point out is that it appears to me
that the price of Crude Oil could begin to pullback before much longer.
During the past year while Crude Oil has remained in a steady up trend it has
rallied for about 6 to 8 weeks (points C to D) and then pulled back for 2 to 4
weeks (points D to C) before making a new high. Currently the price of
Crude Oil since been rising for nearly 8 weeks after making a bottom in late
August so it will be interesting to see if a pullback develops before much longer which could have a
positive effect on the market. 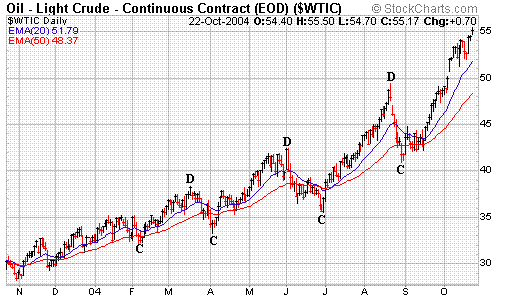
As far as the major averages the Dow
broke below its August low this week. If the price of Oil continues to
rise and the Dow trends lower the two levels to watch for support would be
in the 9600 to 9400 range. The 9600 level coincides with the November 2003
low (point E) and the 9400 level (point F) is at the Dow's longer term 38.2%
Retracement Level (calculated from the October 2002 low to the February 2004
high). Meanwhile if the price of Oil stabilizes and begins to
pullback this could lead to a sharp upside reversal like occurred from mid March
to early April, mid May to mid June and from mid August through early
September. Furthermore when the %K Line in association with the Slow
Stochastics has dropped to around 20 (points G) on a weekly basis this has
signaled a nearing upside reversal in the Dow during the past year. 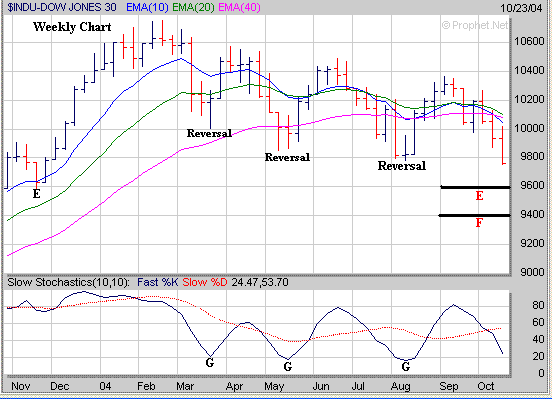
The Nasdaq is at a key support level
near 1900 which is where its 50 Day EMA (blue line), 100 Day EMA (green line),
200 Day EMA (purple line) and upward sloping trend line (brown line) from the
August low are converging at. If the Nasdaq breaks below 1900 then it its
next support level would be just above 1840 (point H). Thus it will be
important for the Nasdaq to hold support near 1900 next week. 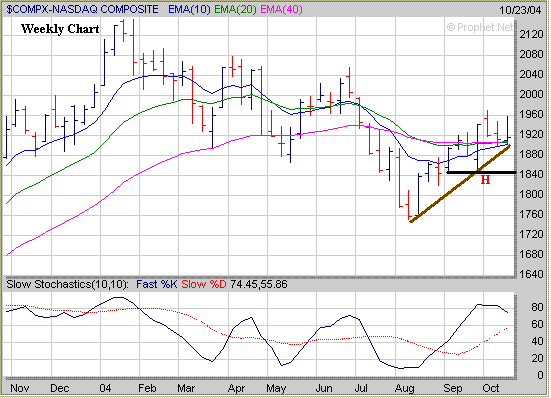
Meanwhile a key sector to watch that
will have an affect on the Nasdaq is the Semiconductors. The Semiconductor
Holders (SMH) tried to rally this week but ran into resistance just below their
100 Day EMA (green line) and closed Friday right at their 50 Day EMA (blue line)
near 31. As I have mentioned in the past the SMH's have a key longer term
support area near 28 (point I). 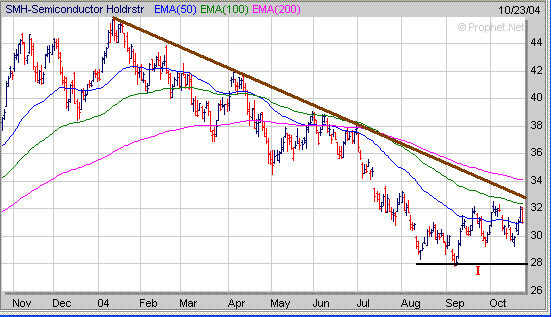
Remember the 28 level is very close
to the SMH's 61.8% Retracement Level calculated from the October 2002 low to the
January 2004 high). If the SMH's break below 28 this would likely lead to
a drop back to their 76.4% Retracement Level near 24 which would have a negative
impact on the Nasdaq. Thus it will be important for the SMH's to hold
support at or above the 28 level the next few weeks. 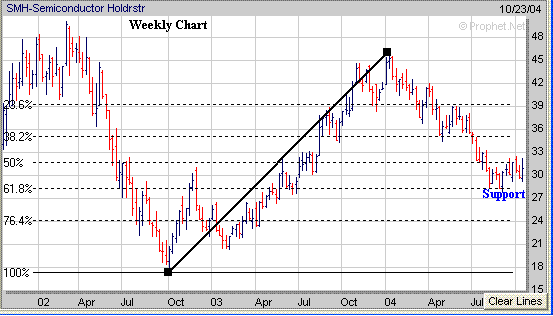
The S&P 500 broke below its 40
Weekly EMA (purple line) near 1100 this week and has a key support level near
1060 which is at the August low (point J). On a weekly basis the %K Line
in association with the Slow Stochastics is still way above the 20 level (point
K). During the past year when the %K line has dropped to 20 or below
(points L) this has signaled a nearing upside reversal. 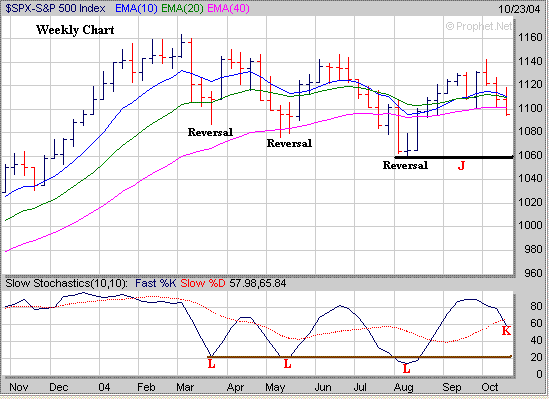
Meanwhile when looking at the
Volatility Index (VIX) which tracks the S&P 500 shows that a similar pattern
maybe developing like occurred from June through early August. Notice the
VIX has formed a Double Bottom (DB) pattern and has pulled back over the past
week similar to what occurred last Summer (points M to N). Meanwhile
last Summer after pulling back for a week or so the VIX then rose strongly to around 20
(points N to O) which led to a bottom in the S&P 500. Thus it will be
interesting to see if this pattern repeats itself. 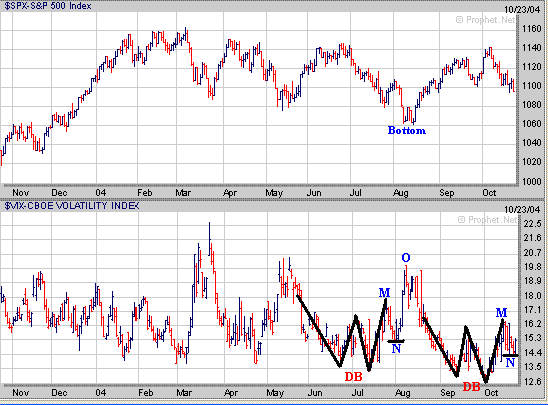
Finally when the market is
correcting it's important to start noticing those stocks which are holding up
the best and developing a favorable chart pattern. Once a bottom does occur
and the market begins to rally these stocks may perform the best. One
chart pattern to look for is the "Cup and Handle" pattern. DISK
is a stock which has just competed the right side of an 11 month Cup and now
needs to develop a constructive Handle over the next few weeks. 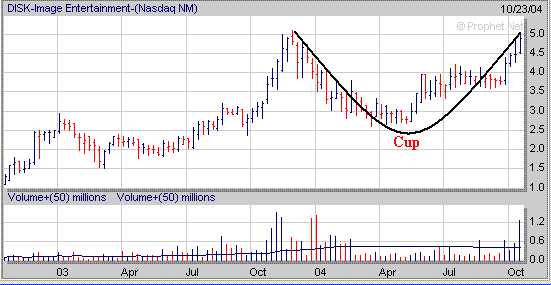
Meanwhile another chart pattern to
look for is a "Double Bottom". TIBX has recently formed a Double
Bottom pattern and is beginning to develop a small Handle (H). 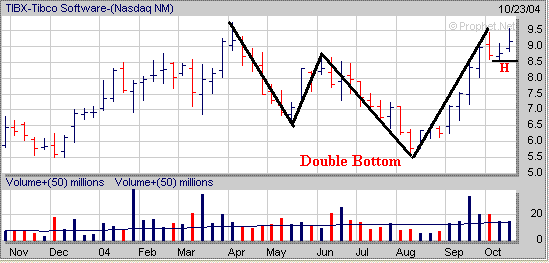
Signup today for a 2
Week Trial Membership and have access to our Stocks
to Watch List which provides a list of Stocks that are exhibiting
favorable Chart Patterns such as those shown above. Also you will receive our Daily Breakout Report
by email which Alerts you to Stocks
that are breaking out of a favorable Chart Pattern from our Stocks
to Watch List.
Click
Here to signup for a "Free" 2 Week Trial Membership
Amateur-Investor.net
|


