|
Weekend Stock Market Analysis
(10/29/05)
The major averages have been very volatile the past two weeks
with big moves in both directions which makes it a difficult trading environment
for most investors. An intra day chart of the Nasdaq with significant
moves during the past two weeks is shown below. 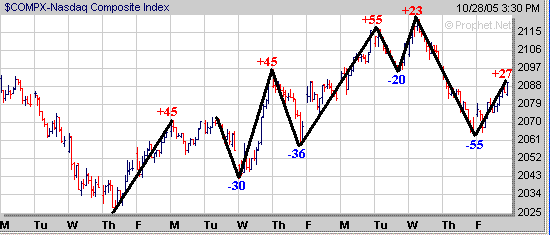 Meanwhile it appears the price of
Crude Oil could be stabilizing as it has held support just above its 40 Weekly
EMA (green line) the past few weeks. As you may recall the last two times
the price of Crude Oil made a significant move upward it pulled back for 8 to 10
weeks (points A to B) and held support above its 40 Weekly EMA prior to rallying
strongly (points B to A). What has been somewhat bothersome the past
two months is that we haven't seen a decent rally in the Dow like we saw the
last two times the price of Crude Oil went through a pullback. Last
November and December the Dow rallied over 1000 points (points C to D) as the
price of Crude Oil pulled back. Furthermore the Dow rallied over 600
points from mid April to mid June (points F to G) as the price of Crude Oil
pulled back. Historically the market is nearing a
seasonally strong period as we approach the end of the year. However if
the price of Crude Oil does begin to rise strongly again during the next few
months the question is will this limit the potential for a year end
rally. 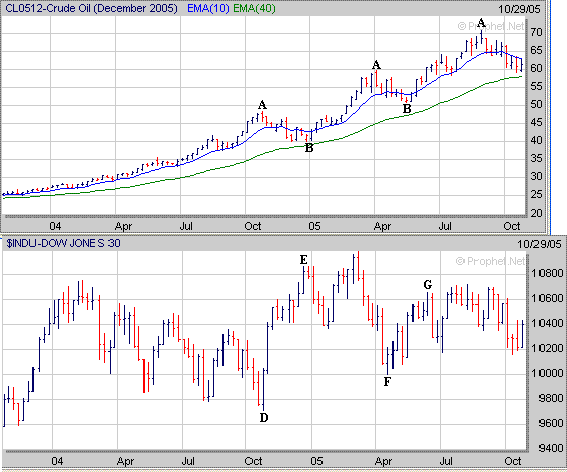
In the near term the Dow has a key
support level near 10150 but has upside resistance near 10450 which corresponds
to its 200 Day EMA (green line). If the Dow is able to break solidly above
the 10450 area then it may rise up to the 10600 to 10700 range in the weeks
ahead. Meanwhile if the Dow is unable to rise above the 10450 area and
eventually breaks below 10150 then it would likely retest its mid April low near
10000 (point H). 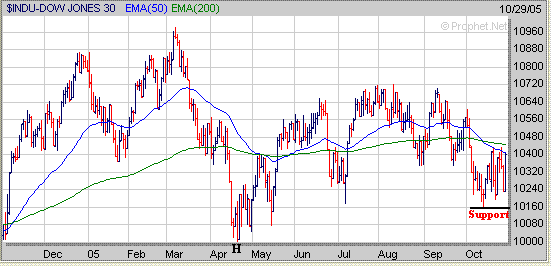
The Nasdaq found support a few weeks
ago near 2025 and then rallied back above to its 50 Day EMA (blue line) before
stalling out near 2120. If the Nasdaq can rally back above the 2120 area
then its next area of upside resistance would be in the 2160 to 2190
range. Meanwhile if the Nasdaq is unable to rise above the 2120 area and
comes under more selling pressure look for support around
2025. 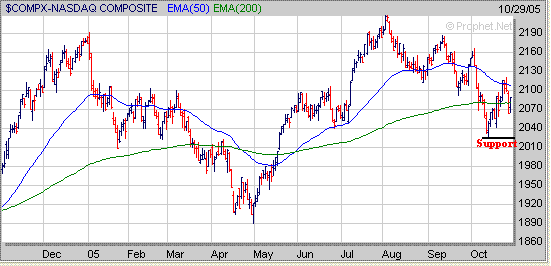
The S&P 500 has a key support
level near 1170 but so far has encountered resistance near its 50 Day EMA (blue
line) just above 1205. If the S&P 500 can break solidly above its 50
Day EMA then it could rise back up to the 1230 to 1240 range in the weeks
ahead. Meanwhile if the S&P 500 is unable to break above its 50 Day
EMA near 1205 and comes under more selling pressure then look for support at
1170. If the 1170 support area were to be broken then the next level of
support for the S&P 500 would likely be the April low near 1140 (point
I). 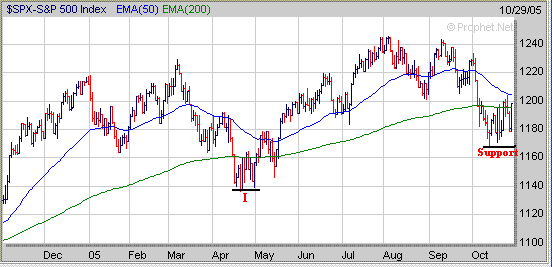
Finally if the market is able to
undergo an end of the year rally continue to focus on those stocks which are
developing a favorable chart pattern. Currently THOR has formed a 1 year
Cup but now needs to work on developing a Handle in the weeks ahead before
moving higher. 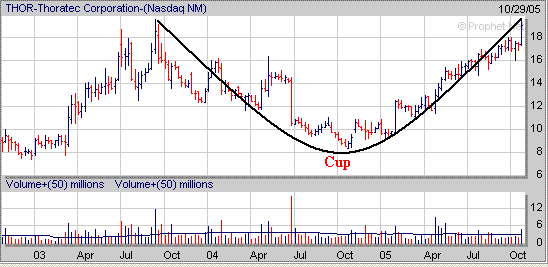
After a stock forms a Cup I like to
see it develop a Handle for at least three weeks before attempting to
breakout. Generally stocks which develop a Handle over a longer period of
time are more successful in following through after breaking out. A few
examples are shown below. HP developed a 14 week Handle after
forming a Cup before breaking out in early Summer. 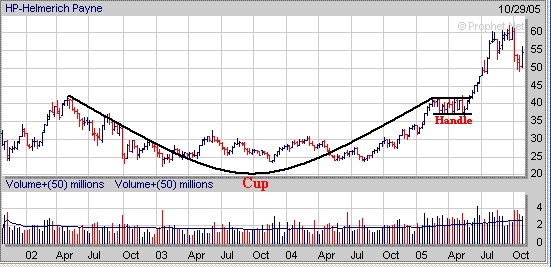
Meanwhile PRLS developed a 10 week
Handle after forming a Cup before breaking out in late Summer. 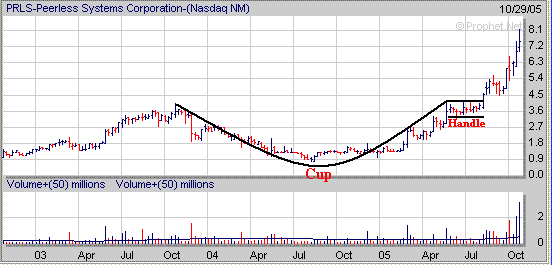
Signup today for a "Free"
2 Week Trial Membership to amateur-investor.net and have access to
our current Stocks to Watch List which contains stocks that are currently developing a favorable chart
pattern such as the Cup and Handle, Double Bottom or Flat Base.
Also you will have access to these other investment products.
Amateur Investor's Top 100 List
Daily Breakout Reports
Market Timing Indicator
Weekly ETF Buy and Sell Signals
Click
Here to Signup for a "Free" 2 Week Trial Membership
Amateur-Investor.net
|


