|
Signup
today for a Free 2 Week Trial Membership
which includes our Stocks to Watch List and Daily Breakout Reports
Weekend Stock Market Analysis
(10/2/04)
Although an oversold bounce was expected this week the strength
on Friday was surprising. However this still doesn't mean we are
completely out of
the woods yet. Once again the Volatility Indexes which track the Nasdaq (VXN)
and S&P 500 (VIX) have quickly dropped back to extremely low levels.
In fact the current VXN looks very similar to what transpired last April as it developed
a Double Bottom pattern (looks like the letter "W") before rising
substantially from late April through mid May. Also notice that the Nasdaq
rallied strongly in mid April (points B to C) after initially selling off
(points A to B) which was then followed by more selling pressure (points C to
D). Thus it will be very interesting to see how things develop over
the next few weeks. 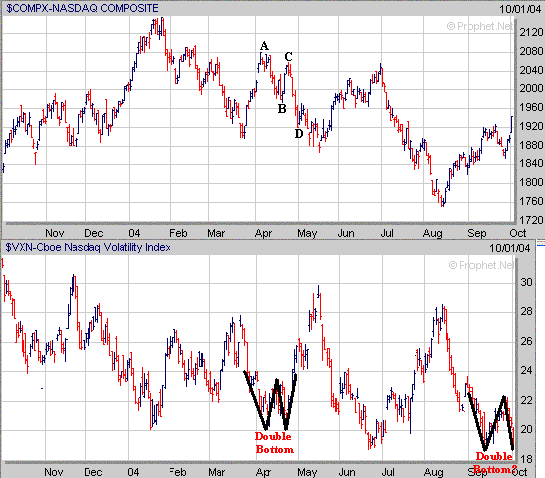
I thought this week instead of
looking at things from a shorter term perspective I would look at a longer term
perspective of the major averages on a Monthly basis and see what their charts
look like. The monthly chart of the Dow shows it has been developing a
potential "Cup and Handle" pattern over the past several months and
has been in a trading range over the past 8 months between 9800 and 10750.
As long as the Dow can hold support at the bottom of its trading range near 9800
then its Handle will remain intact. 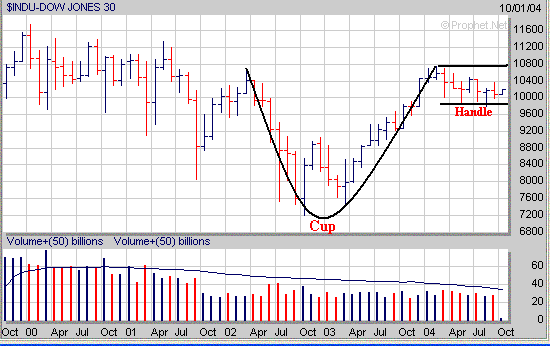
In the longer term there are two
possibilities for the Dow. First if the Dow can break above the top of its
Handle near 10800 which is near its 76.4% Retracement Level (calculated from the
2000 high to the 2002 low) then that would likely lead to a move up to the 11300
level which was its high in 2001 (point E). Meanwhile a second scenario
for the Dow would be for it to fail to hold support at the bottom of its trading
near 9800 which would negate the Handle and probably lead to a move back to its
longer term 50% Extension Level near 9450 (point F). 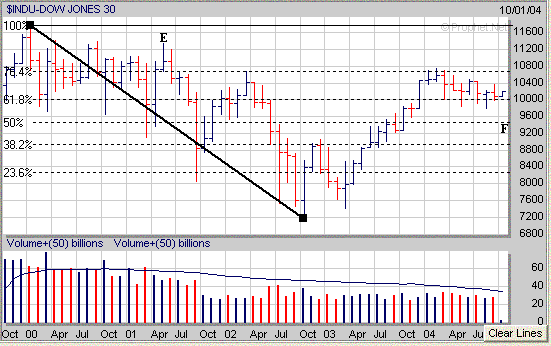
As for the Nasdaq it also appears to
be developing a Cup and Handle pattern on a longer term basis when looking at a
monthly chart and over the past 9 months has been developing a trading range
between 1750 and 2150. 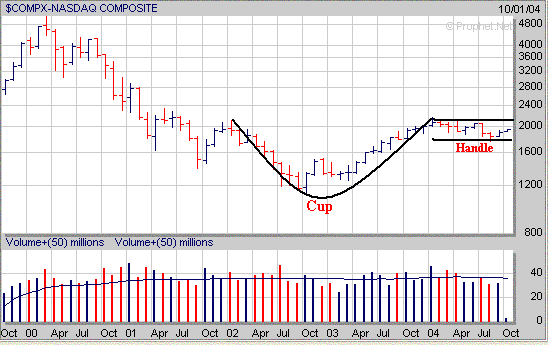
In the longer term there are two
possible scenarios for the Nasdaq. First if the Nasdaq can break above the
top of its Handle near 2150 this could lead to a move up to around 2350 or so
(point B). Meanwhile a second scenario would be for the Nasdaq to break
below the bottom of its Handle near 1750 and lead to a drop back to its 50%
Retracement Level (calculated from the late 2002 low to the early 2003 high)
near 1630 (H). 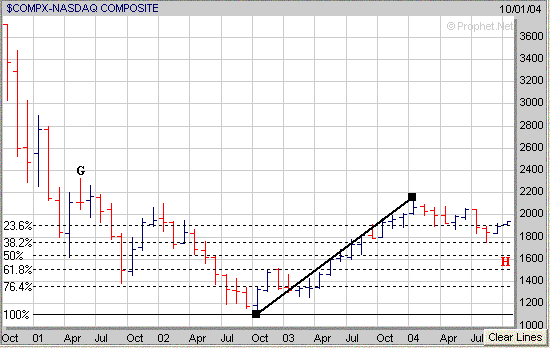 The S&P 500 also appears to be
developing a "Cup and Handle" pattern on a monthly chart as well and
has been in a trading range over the past 8 months between 1060 and 1160. 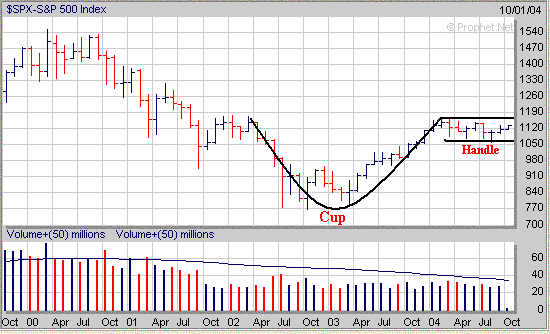
In the longer term there are two
possible scenario's for the S&P 500. First if the S&P 500 can
break above the top of its Handle near 1160 which is at its longer term 50%
Extension Level (calculated from the 2000 high to the 2002 low) then it could
rise up to its 61.8% Extension Level just below 1260 (point I). Meanwhile
a second scenario would be for the S&P 500 to break below the bottom of its
Handle near 1060 leading to a drop back to its 23.6% Extension Level near 950
(point J). 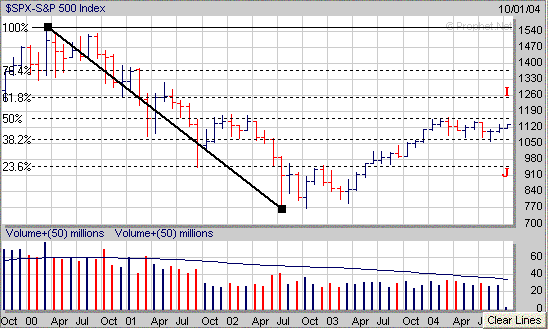
From a historical perspective the
chart of the Dow from the 1920's and 1930's looks very similar to the chart of
the Nasdaq from the 1990's through 2004. As you can see below after the
Dow finally bottomed in the middle part of 1932 it rallied for about a year
(points K to M) and then developed a longer term trading range between 85 and
110 over the next 21 months. The Dow then broke out of its trading range
in the middle part of 1935 and then rallied strongly through the early part of
1937 (points N to O) and gained over 80%. 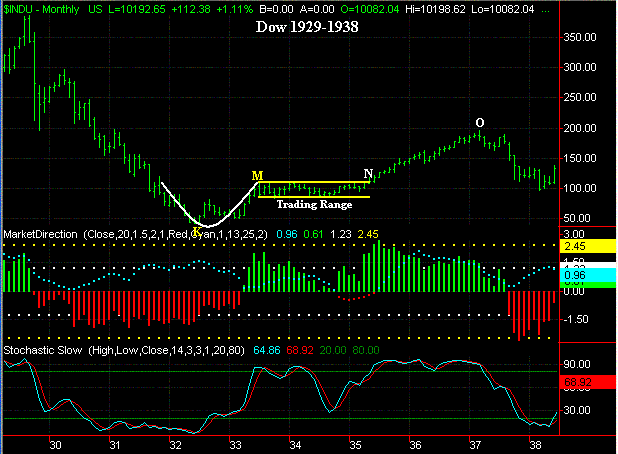
Next looking at the monthly chart of
the Nasdaq shows a similar pattern maybe developing as well and the question is
will the Nasdaq now remain in a trading range between 1750 and 2150 for several
more months before breaking out sometime in 2005? 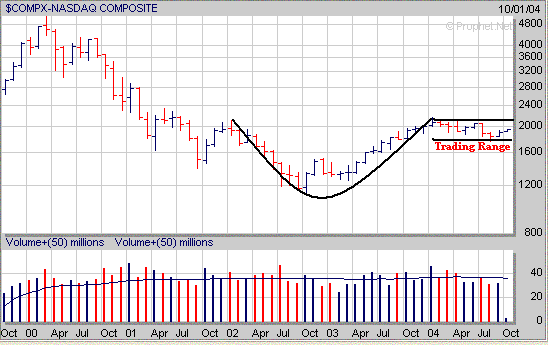 If the major averages do remain in a
trading range for several more months there will still be opportunities in the
market as we see the major averages go through a series of upward and downward
moves while remaining within their respective trading ranges. Investors
who are patient and recognize those stocks which are developing and breaking out
of a favorable chart pattern can still do well. A couple of chart patterns
to look for are the "Cup and Handle" and "Flat
Base". Some recent examples from stocks we mentioned to watch
over the past few months are shown below. (Please note none of these
should be bought now as they are well above their original Pivot Points.) CLF
was a stock we featured in August which broke out of a "Cup and
Handle" pattern in early September. 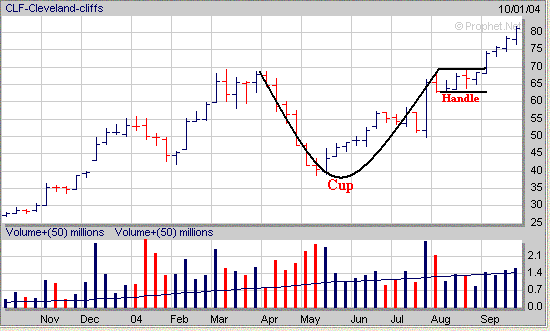
Another one was TXI which broke
out of larger Cup and Handle pattern in late August. 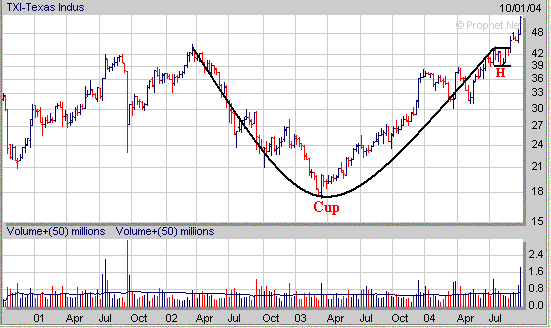
Meanwhile another chart pattern to
look for is a Flat Base. STLD which we featured in August formed a 7 week
Flat Base before breaking out in early September. 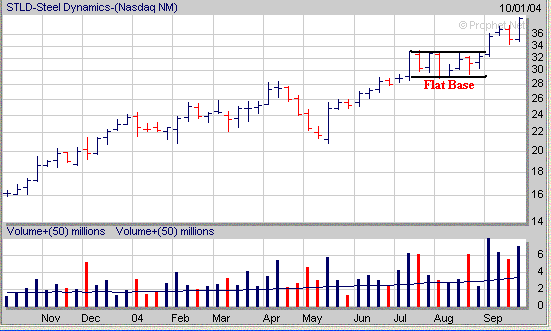
Signup today for a 2
Week Trial Membership and have access to our Market
Timing Indicator (MTI) and our Stocks
to Watch List which provides a list of Stocks that are exhibiting
favorable Chart Patterns along with specific Buy and Stop Loss Prices
in addition to Target Prices. For those that like to short
stocks we also a maintain a small list of potential stocks to short as well.
Also you will receive our Daily Breakout Report
by email which Alerts you to Stocks
that are breaking out of a favorable Chart Pattern from our Stocks
to Watch List.
Click
Here to signup for a "Free" 2 Week Trial Membership
Amateur-Investor.net
|


