|
Signup
today for a Free 2 Week Trial Membership
which includes our Stocks to Watch List and Daily Breakout Reports
Weekend Stock Market Analysis
(10/30/04)
As we have seen over the past several months the price of Crude
Oil and the Dow have been going in opposite directions. When the price of
Crude Oil rises (points A to B) the Dow has dropped (points B to A) and when the price of Crude
Oil drops (points B to A) the Dow rises (points A to B). Another thing to notice is that
the price of Crude Oil has been holding support near its 50 Day EMA (blue line)
while remaining in a steady up trend during the past year. Until we see
the price of Crude Oil break solidly below its 50 Day EMA its longer term up trend
will remain intact. 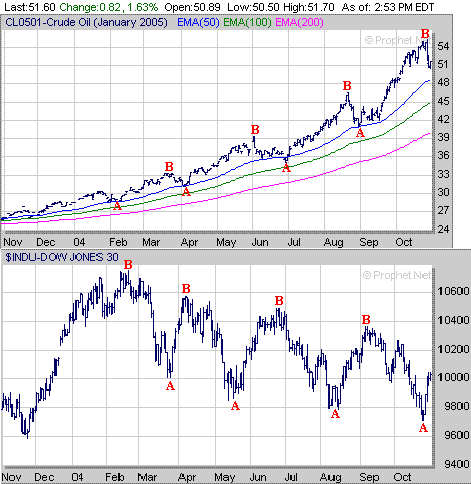
As far as the major averages the
recent drop in the price of Crude Oil has helped the Dow. In the near term
the Dow is approaching its first area of significant resistance in the 10060 to
10100 range which is where its 50 Day EMA (blue line), 100 Day EMA (green line)
and 200 Day EMA (purple line) come into play at. If the Dow is able to
break above 10100 its next level of upside resistance would be near 10275 which
is along its downward sloping trend line (brown line) originating from the
February high. Meanwhile if the Dow is unable to break above 10100 and
then comes under more selling pressure this could lead to an eventual
retest of the low made early last week near 9700 at some point in the future. 
The
Nasdaq which held support near 1900 during the month of October also rallied
last week and is close to its downward sloping trend line (brown line)
originating from the January high. If the Nasdaq continues to rally the
next area of upside resistance may occur around 2000 which is the 61.8%
Extension Level (calculated from the January high to the August low). If
the Nasdaq rallies above 2000 then it may reach the 2060 area (point C) which
coincides with its late June high and 76.4% Extension Level. Meanwhile if
the Nasdaq stalls out near its longer term downward sloping trend line and comes
under some selling pressure the key support level will remain around 1900. 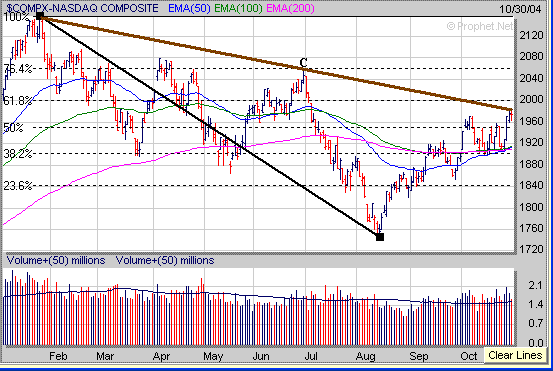
Meanwhile the Semiconductors will
likely have an impact on the Nasdaq in the weeks ahead. The Semiconductor
Holders (SMH) have rallied back to their downward sloping trend line (brown
line) originating from the January high. If the SMH's can break above this
trend line look for a move up to their 200 Day EMA (purple line) near 34 which
will likely help the Nasdaq move higher. Meanwhile if the SMH's stall out
near there current level and begin to pullback look for short term support at
their 50 Day EMA (blue line) near 31. If the SMH's break below 31 then
this could lead to an eventual retest of the August low near 28 (point D) which
would likely have a negative impact on the Nasdaq. 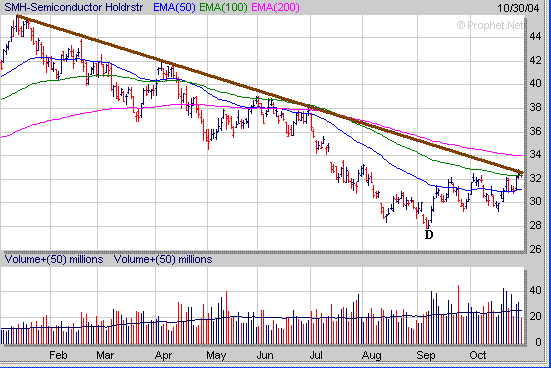
The S&P 500 has rallied back up
to where it was at in mid September (point E). If it continues to rally
look for possible resistance to occur at its early October high (point F) or
June high (point G) in the 1140 to 1145 range. Meanwhile if the S&P
500 stalls out near 1130 and begins to pullback look for initial support near
1115 or so which is where its 50 Day EMA (blue line) and 100 Day EMA (green
line) reside at. 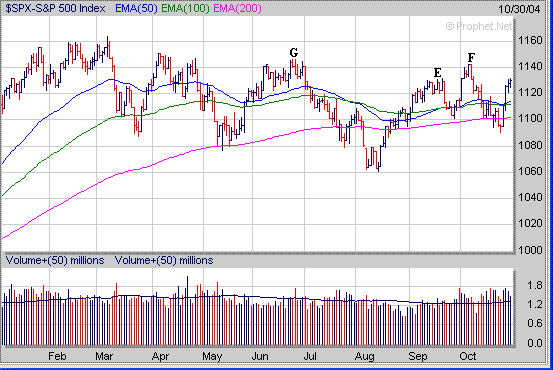
One thing I'm starting to keep an
eye on is the 5 Day Average of the Put to Call Ratio. Over the past two
years when the 5 Day Average has reached dropped to .60 (points H) this has
signaled a nearing top followed by either a sell off (Spring 2002 and Summer
2002) or sideways movement (Summer 2003 and Winter 2004). Right now the 5 Day Average of the Put to Call Ratio is around
.70 so it will be interesting to watch it over the next few weeks. 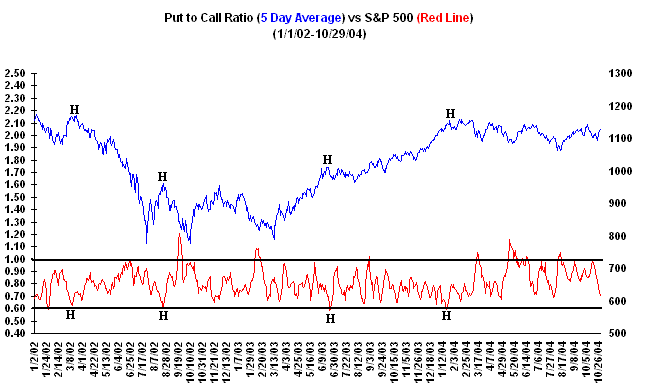
Some of you maybe wondering what the
market did before and after the last election in 2000. The chart of the
Dow shows that it rallied strongly the last two weeks of October in 2000 (points
I to J) leading up to the election and then sold off after the election during the month of November.
Meanwhile you will also notice that the Dow remained in a trading range from
November of 2000 through January of 2001 roughly between 10300 and
11000. 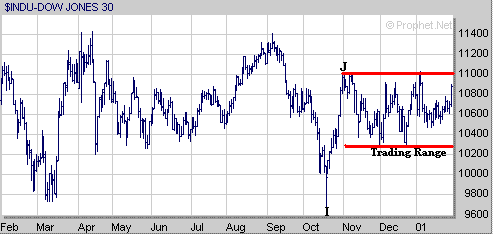
Finally if the market continues to
rally focus on those stocks breaking out of a favorable chart pattern such as a
Double Bottom. VIP is a stock from our Stocks to Watch List which has formed a Double Bottom
pattern and has now developed a 3 week Handle (H) with the Pivot Point at $115. 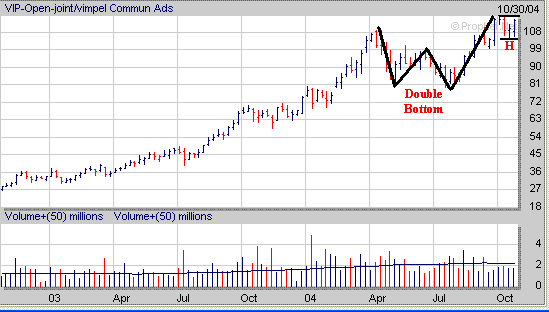
Signup today for a 2
Week Trial Membership and have access to our Stocks
to Watch List which provides a list of Stocks that are exhibiting
favorable Chart Patterns such as those shown above. Also you will receive our Daily Breakout Report
by email which Alerts you to Stocks
that are breaking out of a favorable Chart Pattern from our Stocks
to Watch List.
Click
Here to signup for a "Free" 2 Week Trial Membership
Amateur-Investor.net
|


