|
Weekend Stock Market Analysis
(10/8/05)
The major averages saw a lot of selling pressure this week which
was accompanied by heavy volume. The Dow has dropped well below its 40
Weekly EMA (green line) but so far has held support above its July low near
10200 (point A). If the Dow is able to hold support near 10200 and then
attempts to rally I would look for resistance to occur in the 10350 to 10450
range. Meanwhile if the Dow is unable to hold support near 10200 and
eventually trends lower then its next area of support would be at its April low
around the 10000 level (point B). 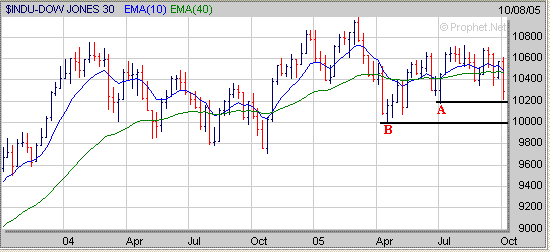
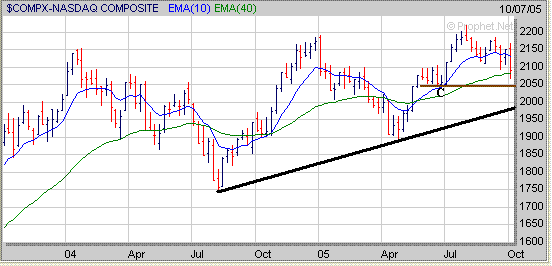
The Nasdaq broke below its 40 Weekly EMA (green line) near 2080
this week but closed just above it on Friday. If the Nasdaq holds support
near its 40 Weekly EMA next week and then attempts to bounce look for resistance
to occur at its 10 Weekly EMA (blue line) near 2130. Meanwhile if the
Nasdaq continues lower the next support area appears to be around 2040 (point C)
which was the low made in June. If the Nasdaq were unable to hold support near
2040 then it could eventually drop back to its longer term upward sloping trend
line (black line) which is currently around 1980.
Meanwhile
keep an eye on the Semiconductors as the Semiconductor Holders (SMH) have
dropped back to their 40 Weekly EMA near 35. If the SMH's are unable to
hold support at their 40 Weekly EMA then this could lead to a drop back to their
June low near 33.75 (point D) which would likely lead to additional selling
pressure in the Nasdaq. 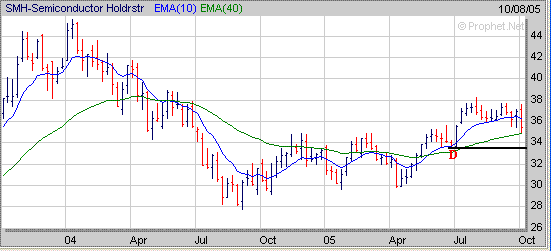
The S&P 500 dropped back to its longer term upward
sloping trend line (black line) originating from the July 2004 low this week
near 1180. If the S&P 500 is able to hold support near 1180 next week
and attempts to bounce look for resistance around 1220. Meanwhile if the
S&P 500 fails to hold support near 1180 and continues lower then its next
area of support would probably be at its April low near 1140 (point E). 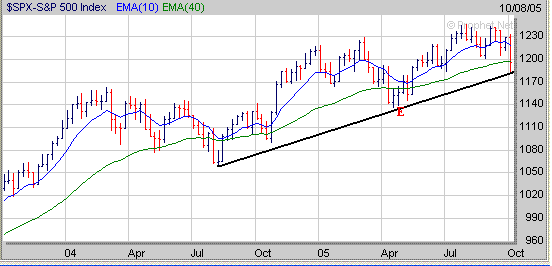
Meanwhile the price of Crude Oil which had held support near
63 the past four weeks sold off this week as well. In the past when the
price of Crude Oil has sold off (points F to G) this has helped the market rally
(points H to I) however so far this hasn't happened this time around. If
the price of Crude Oil continues under selling pressure its next support level
would be at its 40 Weekly EMA (green line) near 57. 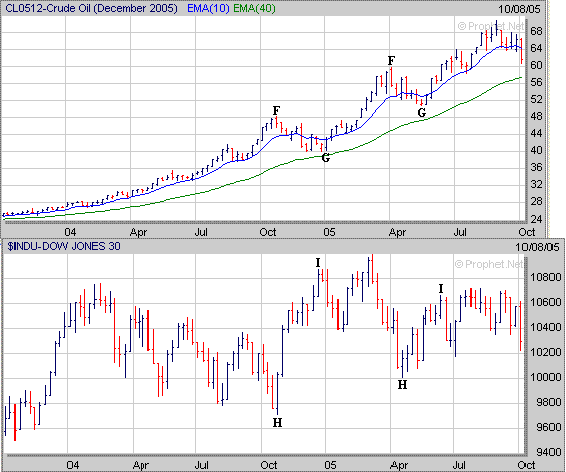
Finally when the market is under selling pressure that is a
good time to start noticing which stocks are acting well since most stocks will
follow the trend of the market. This past week CRDN acted well as it
completed the right side of a 10 month Cup. Over the next few weeks I will
be watching this stock closely to see if it can develop a constructive Handle
to form a Cup and Handle pattern. 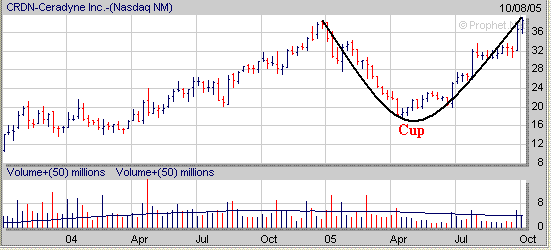
Signup today for a "Free"
2 Week Trial Membership to amateur-investor.net and have access to
our current Stocks to Watch List which contains stocks that are currently developing a favorable chart
pattern such as the Cup and Handle, Double Bottom or Flat Base.
Also you will have access to these other investment products.
Amateur Investor's Top 100 List
Daily Breakout Reports
Market Timing Indicator
Weekly ETF Buy and Sell Signals
Click
Here to Signup for a "Free" 2 Week Trial Membership
Amateur-Investor.net
|


