|
Signup
today for a Free 2 Week Trial Membership
which includes our Stocks to Watch List and Daily Breakout Reports
Weekend Stock Market Analysis
(10/9/04)
An increase in selling pressure occurred this week possibly in
response to the rising price of Crude Oil which has risen $12 a barrel since
making a bottom in late August. As has been the case over the past several
months each time the price of Crude Oil has gone through an extended period of
higher prices the Dow has trended downward and vice versa (points A to B and B
to A). 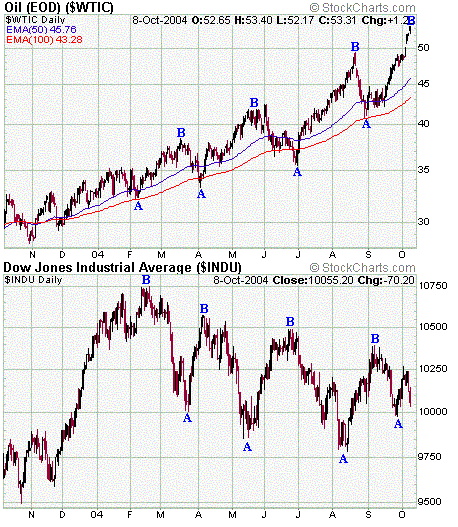
If the price of Crude Oil continues to rise this will likely
have a negative impact on the market in general until we see another sharp
pullback develop in the price of Crude Oil. As far as the major averages
the Dow has
been making a series of lower highs (H) and lower lows (L) since February.
In the near term the Dow has a key psychological support areas around 10000
(point C). If the Dow fails to hold support near 10000 then it will likely
retest its August low near 9800 at some point in October. Meanwhile if the
Dow is able to hold support near 10000 and attempts to rally look for initial
resistance around 10270 (point B). 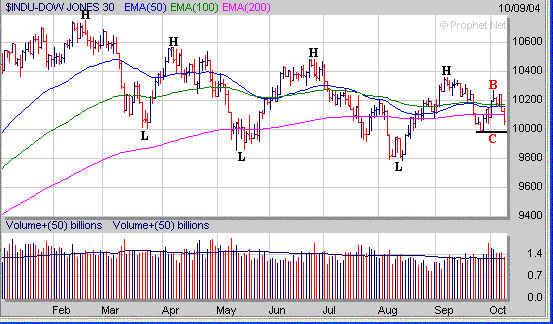
As mentioned last week when looking at a monthly chart of the
Dow it's exhibiting a potential longer term "Cup and Handle" pattern with the
bottom of its Handle near 9800 and the top of its Handle near 10750. In
the weeks ahead in order for the Dow's Handle to remain constructive it will
have to hold support at the bottom of its Handle near 9800. If the 9800 is
broken this would negate the "Cup and Handle" pattern and likely lead
to a much larger drop. 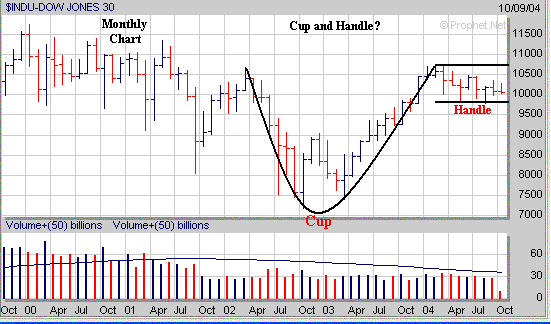
The Nasdaq also has been making a series of lower highs and
lower lows since Janaury and the question is at this point has the Nasdaq now
made another lower high in the near term? A key support area to watch for
next week is in the 1900 to 1910 area which is where the Nasdaq's 200 Day EMA
(purple line), 100 Day EMA (green line) and 50 Day EMA (blue line) come into
play at. If the Nasdaq fails to hold support in the 1900-1910 range then
its next level of support would possibly be at its 23.6% Extension Level
(calculated from the January high to the August low) near 1840 (point D).
Meanwhile if the Nasdaq can hold support in the 1900-1010 area and rallies I
would look for resistance to occur at its high last week near 1970. 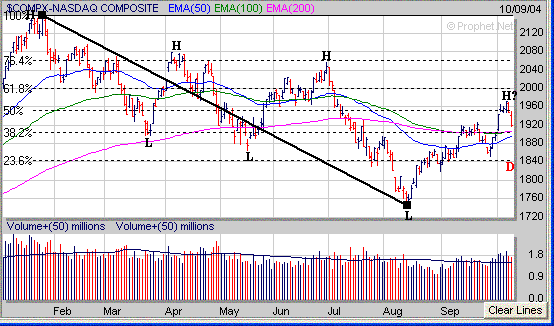
In the longer term the Nasdaq is still exhibiting a potential
"Cup and Handle" pattern as well with the bottom of its Handle around 1750 and
the top of its Handle near 2150. As long as the Nasdaq can hold support at
or above 1750 in the weeks ahead its Handle will remain constructive. 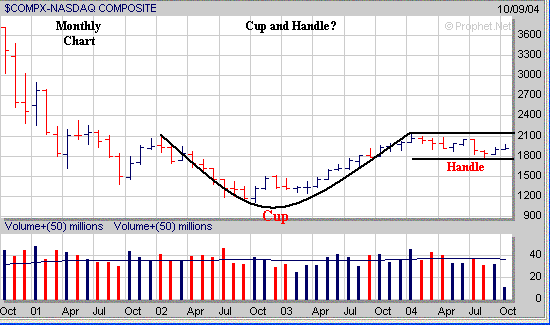 The S&P 500 just like the Dow and Nasdaq has been making
a series of lower highs (H) and lower lows (L) since March and the question is
has the S&P 500 made another lower high? In the near term a key
support level to watch next week is just above 1110 which is where the S&P
500's 100 Day EMA (green line) and 50 Day EMA (blue line) reside at. If
the S&P 500 fails to hold support just above 1110 then its next support area
would be at its 200 Day EMa (green line) near 1100. Meanwhile if the
S&P 500 is able to hold support near 1110 and attempts to rally look for
resistance at last weeks high near 1140. 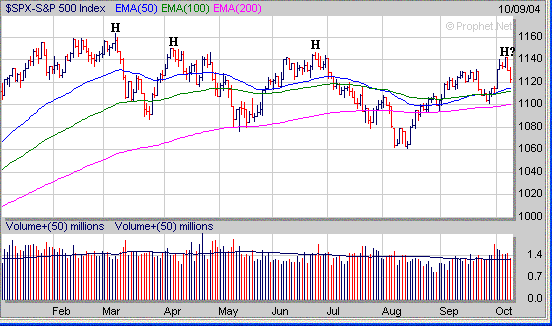
In the longer term just like the Dow and Nasdaq the S&P
500 is also exhibiting a potential "Cup and Handle" pattern as well
with the bottom of its Handle near 1060 and the top of its Handle near
1160. As long as the S&P 500 can hold support at or above 1060 in the
weeks ahead then its Handle will remain constructive. 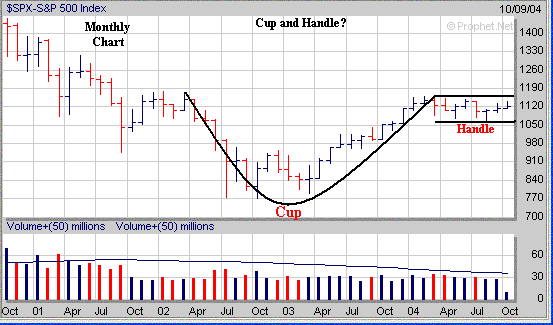
One sector I will be watching over the next few weeks is the
Semiconductors. This past week the Semiconductor Holders (SMH) encountered
some resistance near their 20 Weekly EMA (green line) around 32.50. As I
have mentioned before the SMH's have a key longer term support area near 28
(point E) which is at their 61.8% Retracement Level (calculated from the October
2002 low to the January 2004 high). If the SMH's can hold support at or
above the 28 level this would be a positive sign. However if the SMH's
break below 28 this could lead to a drop back to their 76.4% Retracement Level
near 24 (point F) which would likely have a negative affect on the Nasdaq. 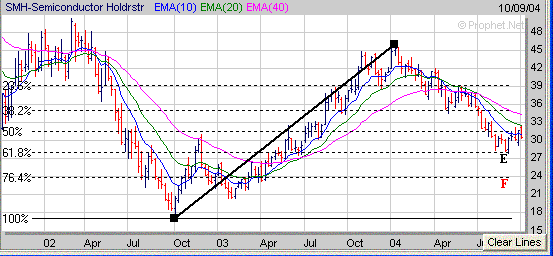
Some of you have asked about the Volatility Index that tracks
the Nasdaq 100 (VXN) and S&P 500 (VIX). I thought this week I would
elaborate a little bit about the VXN. The CBOE first began to publish VXN
values in the early part of 2001 and a chart comparing the Nasdaq to the VXN is
show below. As you can see the VXN values have been trending much lower
over the past 2 years as compared to 2001 and 2002. During the past year
the VXN has basically been in a trading range between 20 and 30 while the Nasdaq
has gradually trended lower in a choppy fashion. At least during
the past year when the VXN has risen into the mid to upper 20's (points G) this
has signaled a nearing upside reversal (points H to I) while a drop into the
upper teens to around 20 (points J) has signaled a nearing downside reversal
(points I to H). The main reason I had mentioned during the past few weeks
to be on the lookout for a possible downside reversal in the Nasdaq was the fact
that the VXN had dropped below 20 (point K) and based on previous occurrences
during the past year I thought some selling pressure could develop. Of
course that doesn't mean this pattern will continue forever however so far it
has been fairly reliable during the past year. 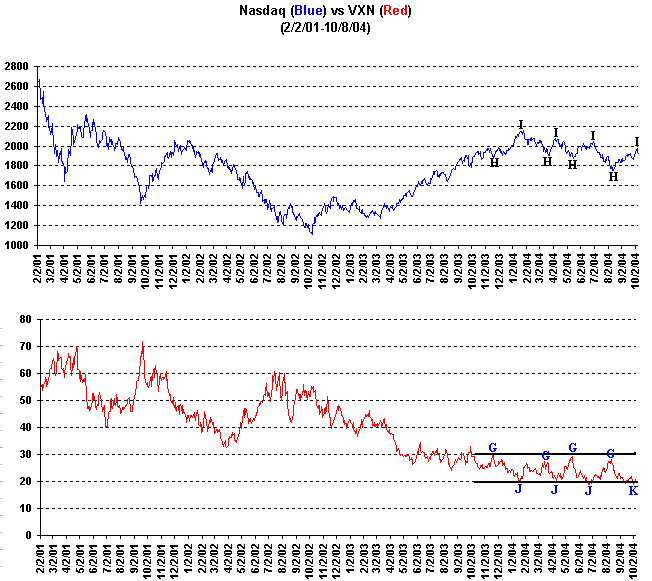
No matter what happens in the weeks ahead you have to be
prepared to take advantage of the market. When the market was correcting
from July through mid August it was important to know which stocks were acting
well and developing a favorable chart pattern such as a "Cup and
Handle" for example. Notice as the Nasdaq was correcting
from July through mid August (points L to M) that NCX was acting well as it
began to break out of a Cup and Handle pattern in mid July (point O). As
the Nadaq continued lower NCX then traded sideways for about 3 weeks before
breaking out again in mid September as the Nasdaq began to rally. The
initial Pivot Point on NCX was just above $29 and by early October NCX rose to
just above $39 for a gain of nearly 35%. 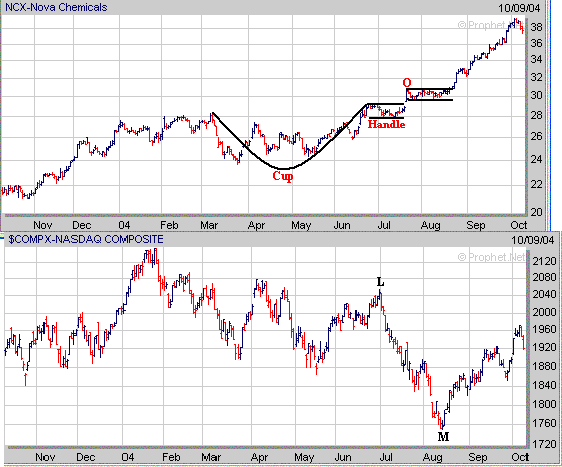
If the market continues to correct make sure to start
noticing which stocks are holding up well and beginning to develop a favorable
chart pattern as this will give you a clue to those stocks which may do well in
the future.
Signup today for a 2
Week Trial Membership and have access to our Market
Timing Indicator (MTI) and our Stocks
to Watch List which provides a list of Stocks that are exhibiting
favorable Chart Patterns along with specific Buy and Stop Loss Prices
in addition to Target Prices. For those that like to short
stocks we also a maintain a small list of potential stocks to short as well.
Also you will receive our Daily Breakout Report
by email which Alerts you to Stocks
that are breaking out of a favorable Chart Pattern from our Stocks
to Watch List.
Click
Here to signup for a "Free" 2 Week Trial Membership
Amateur-Investor.net
|


