|
Weekend Stock Market Analysis
(9/24/05)
The price of Crude Oil tried to rally this week but stalled out
near the 68 level and then dropped back to its 10 Weekly EMA (blue line) by the
end of the week. Crude Oil still has a key support level around 63 (point
A) and it will be interesting to see if it can maintain support at this level or
not next week. If the price of Crude Oil were to drop below the 63 level
then this could help the market rally in the near term. Meanwhile
as you can see the price of Crude Oil has been in a steady up trend since late
2003. Also note that after each major run up in price (points B to C) this
has been followed by a pullback lasting from 8 to 10 weeks (points C to B)
before Crude Oil makes another substantial move upward. If we see a
similar pullback occur again then we may see the price of Crude Oil either trade
sideways or trend a little lower over the next 4 to 6
weeks. 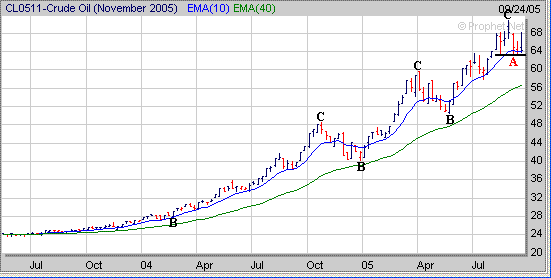
Meanwhile more selling pressure occurred this
week in the major averages. The Nasdaq did manage to hold support near the
2100 level which was a previous upside resistance area and also coincided with
its 38.2% Retracement Level (calculated from the late April low to the early
August high). If the Nasdaq tries to bounce next week look for possible
upside resistance near 2140 which corresponds to its 50 Day EMA (blue line) and
23.6% Retracement Level. Meanwhile if the Nasdaq doesn't bounce next week and eventually breaks below the 2100 level then it's next area of
support would be either at its 200 Day EMA (green line) near 2075 or at its 50%
Retracement Level near 2055. 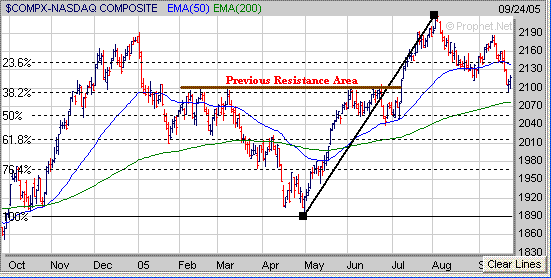
The Dow so far has held support near
its late August low around 10350 (point D). If the Dow attempts to bounce next week look for initial resistance at its 50 Day EMA (blue line) near
10530. Meanwhile if the Dow drops below the 10350 area then its next level
of support would be around 10250 which corresponds to its upward sloping trend
line (brown line) originating from the October 2004 low. If the Dow were
to break below its longer term upward trend line then a retest of its April low
near 10000 would likely occur (point E) at some point this Fall. Thus it
will be important for the Dow to hold support at or above this trend line in the
weeks ahead. 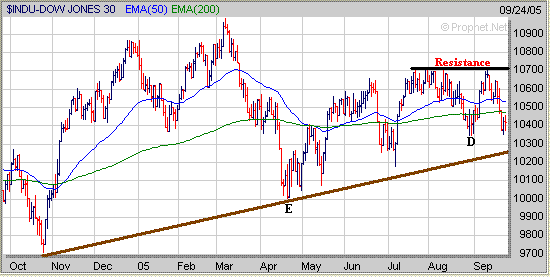
As for the S&P 500 it has
dropped below its 50 Day EMA (blue line) near 1222 but so far has held
support above its 200 Day EMA (green line) near 1195. If the S&P 500 bounces next week look for initial resistance at its 50 Day EMA near
1222. Meanwhile if more selling pressure occurs in the S&P 500 look
for support at its 200 Day EMA near 1195. 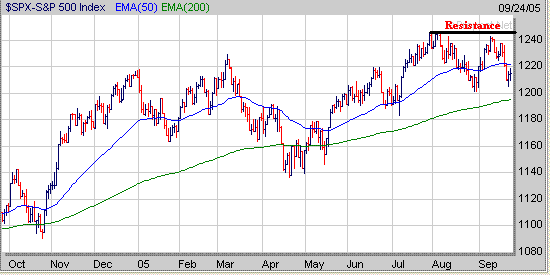
In the longer term I believe the key
level to watch in the S&P 500 is around 1180 which coincides with its upward
sloping trend line (black line) originating from the July 2004 low. As
long as the S&P 500 can hold support at or above this trend line then its
upward bias will remain intact. However if this trend line were to be
violated then that could signal a longer term change in direction for the
S&P 500. 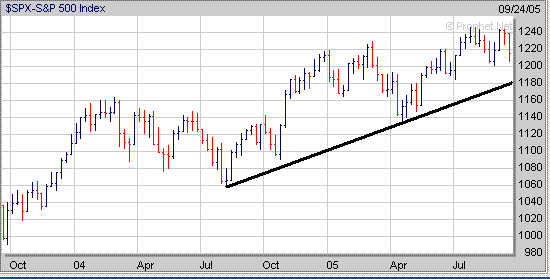
For
those watching Gold the XAU has developed a potential Double Bottom pattern over
the past two years as it has encountered resistance near 112 which corresponds
to its longer term 61.8% Retracement Level (calculated from the 1996 high to the
2000 low). If the XAU eventually breaks solidly above its 61.8%
Retracement Level then I would expect a move up to its 76.4% Retracement Level
near 129 (point F) in the future. 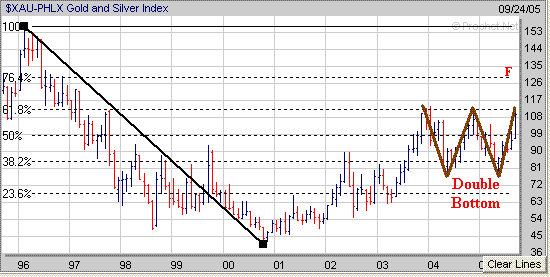
Finally I know for many investors
2005 has been a challenging year as the market has been very choppy along with
many stocks. However if you focus on those stocks breaking out of a favorable
chart pattern you can still make some money. Recently RIO broke
out of a Cup and Handle pattern in early September and has followed through to
the upside and has gained around 18% since we featured it in our Stocks to Watch
List in August. Please note RIO is too far above its Pivot Point to be
bought now. 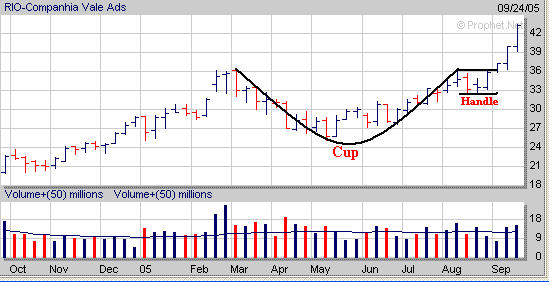
Signup today for a "Free"
2 Week Trial Membership to amateur-investor.net and have access to
our current Stocks to Watch List which contains stocks that are currently developing a favorable chart
pattern.
Also you will have access to these other investment products.
Amateur Investor's Top 100 List
Daily Breakout Reports
Market Timing Indicator
Weekly ETF Buy and Sell Signals
Click
Here to Signup for a "Free" 2 Week Trial Membership
Amateur-Investor.net
|


