|
Signup
today for a Free 2 Week Trial Membership
which includes our Stocks to Watch List and Daily Breakout Reports
Weekend Stock Market Analysis
(9/25/04)
For those that read my column each week the selling pressure
that developed in the market shouldn't have been a surprise to anyone. As
I have stated over the past two weeks when the Volatility Index that tracks the
Nasdaq 100 (VXN) and S&P 500 (VIX) drops to very low levels that is a signal
of too much complacency in the market which usually leads to some type of
correction/pullback. As shown below during the past
year when the VXN has dropped to 20 or below (points A) this has led to an
eventual top followed by a correction (points B to C). 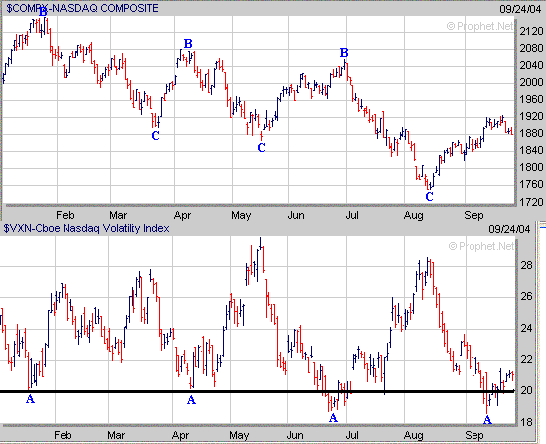 Meanwhile the rising price of Crude
Oil is probably one of the culprits for the increasing selling pressure of late
as Crude Oil is nearing its August high near $50. The question is at this
point what happens once the price of Crude Oil reaches its August
high? If the price of Crude Oil surges past $50 this will likely
spell big trouble for the market as during the past several months Crude Oil and
the Dow have been going in opposite directions. Notice below when the
price of Crude Oil rises the Dow corrects (points D to E) and when the price of
Crude Oil drops the Dow rallies (points E to D). Meanwhile if the
price of Crude Oil stalls out near its August high and develops a Double Top
pattern then that could lead to a quick sell off in Crude Oil which would likely
have a positive impact on the market down the road. Thus over the next few
weeks it's
going to be very interesting to see what happens to the price of Crude
Oil. 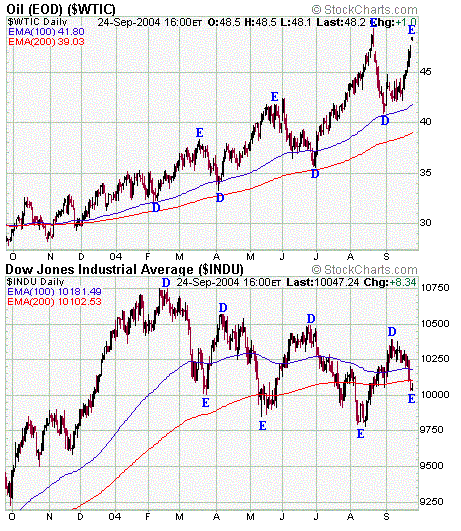
As far as the major averages the Dow
has broken below its 200 Day EMA (purple line) and is nearing a psychological
support area near 10000. If the price of Crude Oil stabilizes next week
and the Dow can hold support near 10000 (point F) then this could lead to a
minor rally with the Dow possibly rising up to the 10180 level which is where
its 50 Day EMA (blue line) and 100 Day EMA (green line) reside at.
Meanwhile if the Dow fails to hold support at 10000 and continues lower look for
a retest of its August low near 9800 (point G) at some point. 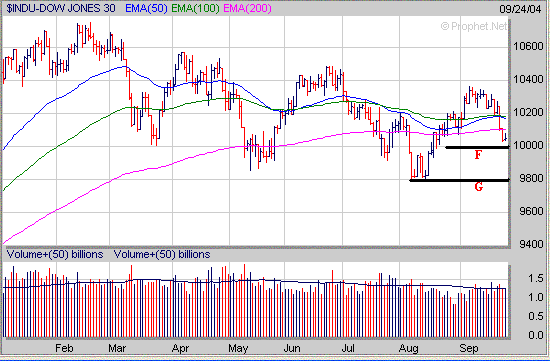
The Nasdaq is at a key short term
support area at its 50 Day EMA (blue line) near 1880. If the Nasdaq can
hold support near 1880 and then rally look for resistance to occur around 1920
(point H). Meanwhile if the Nasdaq fails to hold support near 1880 then
look for a quick drop back to the 1840 level (point I). In the longer term
if the Nasdaq breaks below 1840 this would likely lead to a retest of its August
low near 1750 (point J) sometime in October. 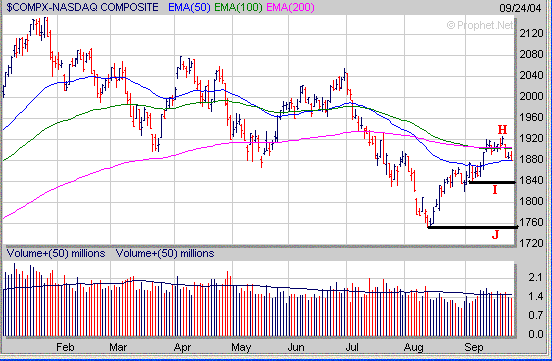
One sector that may have a big
influence on the Nasdaq is the Semiconductors. The Semiconductors Holders
(SMH) got hit hard on Friday and if they break below 30 look for a quick drop
back to the 28 level (point K) which could lead to additional selling pressure
in the Nasdaq. 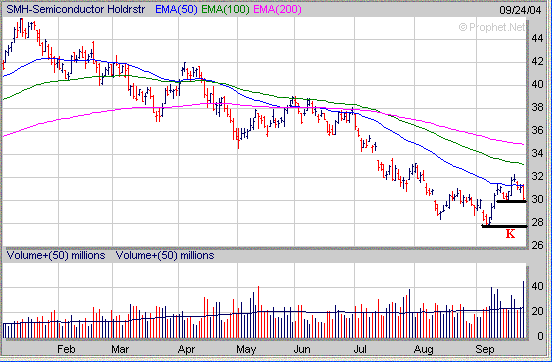
Also remember the 28 level is a key
longer term support area for the SMH's which is at their 61.8% Retracement Level
(point L) calculated from the October 2002 low to the January 2004 high.
If the SMH's drop below 28 this would likely lead to a much larger drop back to
their 76.4% Retracement Level near 24. Thus it will be very important for
the SMH's to hold support near 28 if they break below 30 in the days ahead. 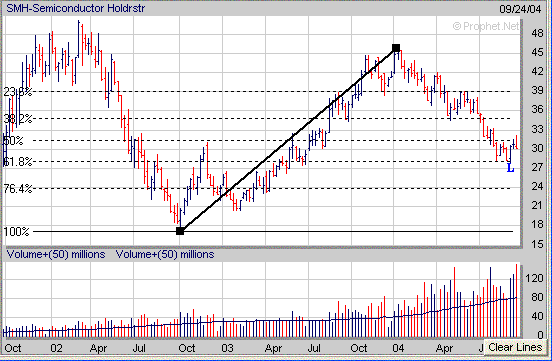
The S&P 500 so far has
held support near 1110 which is where its 50 Day EMA (blue line) and 100 Day EMA
(green line) reside at. If the S&P 500 can hold support near 1110 and
then rally look for resistance to occur near 1130 (point M). Meanwhile if
the S&P 500 drops below 1110 its next area of support would be at its 200
Day EMA (purple line) just below 1100. In the longer term if the S&P
500 breaks below 1100 this could lead to an eventual retest of the August low
near 1060 (point N) sometime in October. 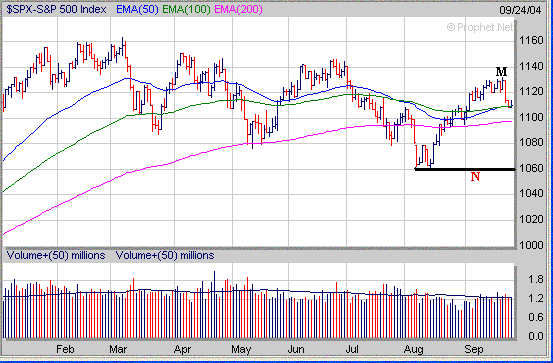
Remember the two things
to
watch next week are the price of Crude Oil and the Semiconductor Holders (SMH).
If the price of Crude Oil surges above the August high and the SMH's break below
30 this will likely lead to additional selling pressure in the market.
Meanwhile if the price of Crude Oil stabilizes near its August high and the
SMH's can hold support near 30 then we could see a minor rally develop. Finally
when the market is in a correction mode that is when you should be paying close
attention to those stocks which are acting well. A stock from our
Portfolio which has done very well since mid August is NCX. As you can see
below NCX developed a 4 month Cup from March through June and then formed a 4
week Handle (H) before breaking out in late July accompanied by big volume
(point V). Also notice while the market was correcting from July through
mid August that NCX traded nearly sideways during that period of time before
heading higher again as the market put in a bottom in mid August and began
to rally through mid September. Remember leading stocks
will act much better while the market is correcting and then surge higher again
once the correction is done and the market begins to rally. 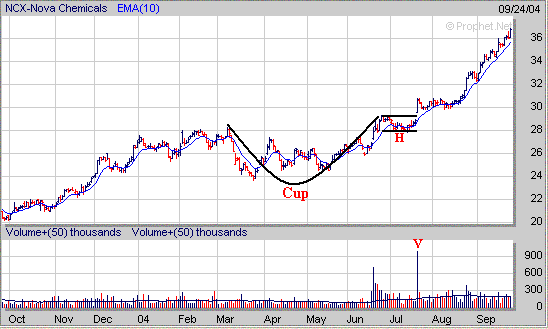
Signup today for a 2
Week Trial Membership and have access to our Market
Timing Indicator (MTI) and our Stocks
to Watch List which provides a list of Stocks that are exhibiting
favorable Chart Patterns along with specific Buy and Stop Loss Prices
in addition to Target Prices. For those that like to short
stocks we also a maintain a small list of potential stocks to short as well.
Also you will receive our Daily Breakout Report
by email which Alerts you to Stocks
that are breaking out of a favorable Chart Pattern from our Stocks
to Watch List.
Click
Here to signup for a "Free" 2 Week Trial Membership
Amateur-Investor.net
|


