|
Due to the devastating damage caused by
Hurricane Katrina we are donating 50% of each new Membership Sale to the
Relief Effort. Our goal is to raise $2,000 by the end of September.
If interested in helping with this cause
please click on the link below for more information.
Weekend Stock Market Analysis
(9/3/05)
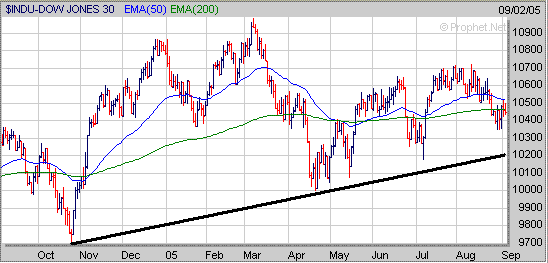
A minor bounce occurred this week as the major averages had become somewhat
oversold. The Dow
rallied back to its 50 Day EMA (blue line) this week near 10520 but was unable
to rise above it. At this point there are two possibilities for the Dow in
the short term. The first possibility would be for the Dow to rise above
its 50 Day EMA with a rally up to the 10650 to 10700 range. Meanwhile the
second possibility would be for the Dow to break below the 10350 area leading to
a drop back to its upward sloping trend line (black line) near 10200 which
originates from the October 2004 low.
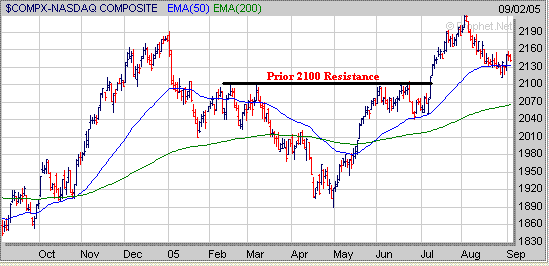
The Nasdaq has rallied back above its 50 Day EMA (blue line) after dropping
below it last week. If the Nasdaq can hold support at its 50 Day EMA near
2130 and break above the 2160 area then it could rise up to its previous high
made in early August near 2220. On the other hand if the Nasdaq were unable
to hold support at its 50 Day EMA then I would look for support at its previous
resistance level near 2100. If the Nasdaq were to break below the 2100 area
then its next level of support would be at its 200 Day EMA (green line) near
2070.
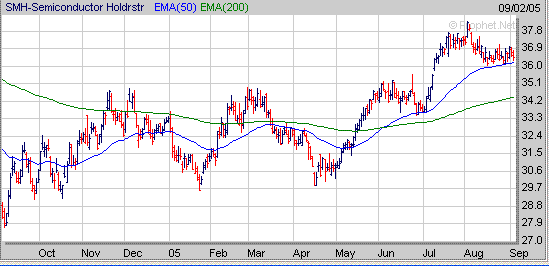
 One sector to keep an eye on which
may have an impact on the Nasdaq in the weeks ahead is the Semiconductors.
During the past three weeks the Semiconductor Holders (SMH) have been trading
nearly sideways while holding support at their 50 Day EMA (blue line) near 36.
At some point the SMH's are going to break out of this trading range and make a
strong move in one direction or the other. If the SMH's breakout to the
upside then this would have a positive impact on the Nasdaq. However if
the SMH's broke below the 36 level then I would expect a quick drop back to
their 200 Day EMA (green line) near 34.25 which would have a negative affect on
the Nasdaq.
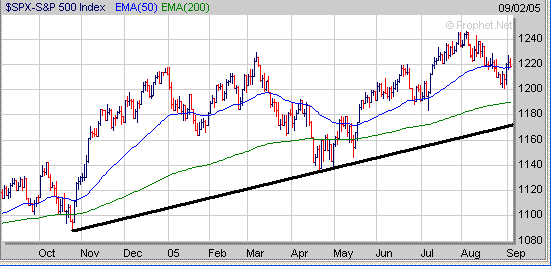
As far as the S&P 500 it has rallied back above its 50 Day EMA (blue line)
as well. In the near term if the S&P 500 can hold support at its 50
Day EMA near 1220 and rally above the 1230 level then this could lead to a rally
back to its previous early August high near 1243. However if the S&P
500 were to come under more selling pressure and break below the 1200 level then
its next area of support would either be at its 200 Day EMA (green line) near
1190 or at its upward sloping trend line (black line) near 1170 which originates
from the October 2004 low.
 As
I have mentioned before historically the month of September has been the worst
performing month for the Dow going back to 1900 as nearly 70% of the time the
Dow has ended the month with a negative return. Of course some years have
been worse than others as can be seen during the past five years as the Dow was
down 5% in 2000, 11% in 2001, 12% in 2002, 1.5% in 2003 and around 1% in
2004. Thus we shall see if September of 2005 will end up being another
down month for the Dow. If the market doesn't follow its
historical trend of being down in September and actually does well this month
focus on those stocks which have formed a favorable chart pattern. For example ARRS from our current
Stocks to Watch List is still exhibiting a favorable "Cup and Handle"
pattern. 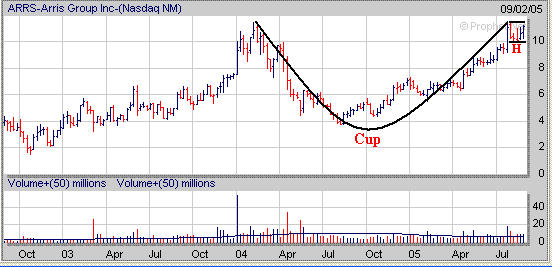
Signup today for a "Free"
2 Week Trial Membership to amateur-investor.net and have access to
our complete list of stocks which are currently developing a favorable chart
pattern in addition to ARRS mentioned above.
Also you will have access to these other investment products.
Amateur Investor's Top 100 List
Stocks to Watch Buy List
Daily Breakout Reports
Market Timing Indicator
Weekly ETF Buy and Sell Signals
Click
Here to Signup for a "Free" 2 Week Trial Membership
Amateur-Investor.net
|


