|
Signup
today and save 50% on a Premium Membership Plan
which includes our Stocks to Watch List and Daily Breakout Reports
(This Special Offer will expire on Labor Day)
Weekend Stock Market Analysis
(9/4/04)
Although the market has gone through a nice 3 week rally from
oversold conditions a few things are developing which could signal the major
averages are potentially getting close to a top. First the Volatility
Index (VIX) which tracks the S&P 500 has dropped back below a value of 14
(point A) which has signaled a nearing top on three separate occasions during
the past year (points B). 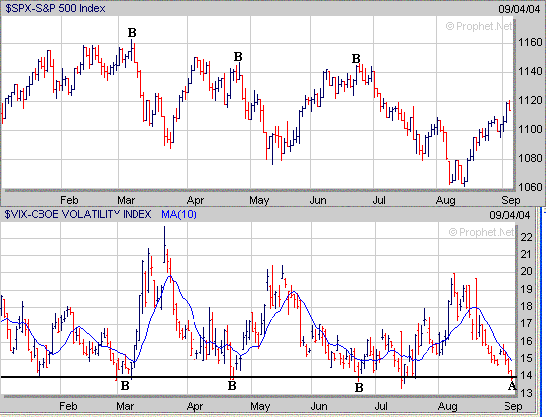 Meanwhile the second thing that is
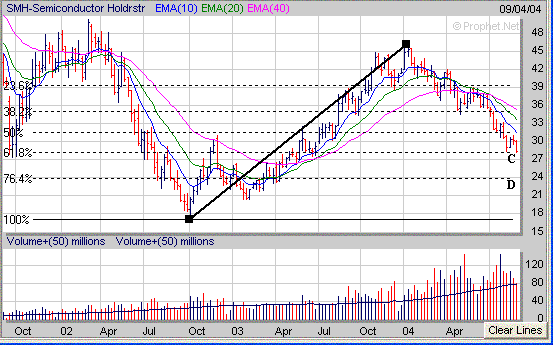
worrisome is the action in the Semiconductors as the Semiconductor Holders (SMH)
haven't been acting well and are back at a critical longer term support area
near their 61.8% Retracement Level (point C) just above 28 (calculated from the
October 2002 low to the January 2004 high). If the SMH's fail to hold
support near 28 then look for an eventual drop back to their 76.4%
Retracement Level at 24 (point D) which will likely lead to additional selling
pressure especially in the Nasdaq.
 As far as the major averages the Dow
has rallied back above its 50% Extension Level (calculated from the February
high to the August low) and has risen over 500 points since mid August. If
the Dow comes under more selling pressure I would look for short term support in
the 10150 to 10175 range which is where its 50 Day EMA (blue line), 100 Day EMA
(green line) and 38.2% Extension Level reside at. I believe the
highest level the Dow may reach during the month of September would be just
below 10400 as that is where its 61.8% Extension Level (point E) resides
at. 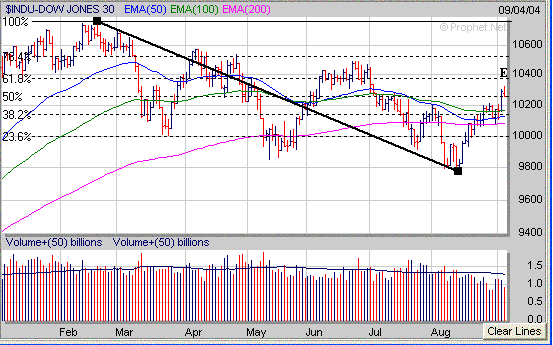
The Nasdaq has encountered
resistance at its 50 Day EMA (blue line) near 1875 and reversed strongly to the
downside on Friday mainly due to Intel's negative mid quarter update.
If more selling pressure occurs early next week in the Nasdaq a key short
term support level to watch is around 1820 (point F). If the Nasdaq breaks
below1820 this would likely lead to a retest of the mid August low near 1750 at
some point in September. Meanwhile if the Nasdaq can hold support near
1820 and eventually rally above its 50 Day EMA I would expect significant upside
resistance to occur in the 1900 to 1910 range which is where its 38.2% Extension
Level, 100 Day EMA (green line) and 200 Day EMA (purple line) reside at. 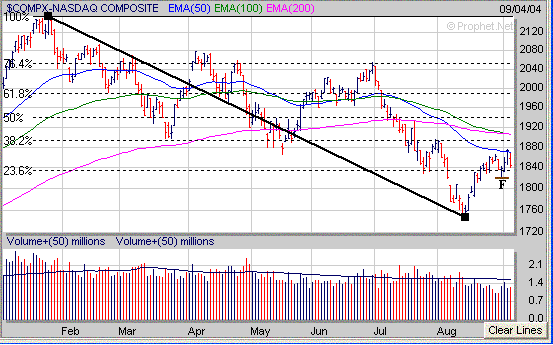
The S&P 500 has rallied back to
just below its 61.8% Extension Level (calculated from the March high to the
August low) near 1123 (point G). If some selling pressure develops in the
S&P 500 I would look for short term support in the 1100 to 1105 range which
is where its 50 Day EMA (blue line), 100 Day EMA (green line) and 38.2%
Extension Level reside at. Meanwhile to the upside I would expect the
S&P 500 to run into resistance around the 1123 which as mentioned above is
at its 61.8% Extension Level. If the S&P 500 can break above 1123 then
this could eventually lead to a move up to its 76.4 Extension Level near 1140 at some point
in September. 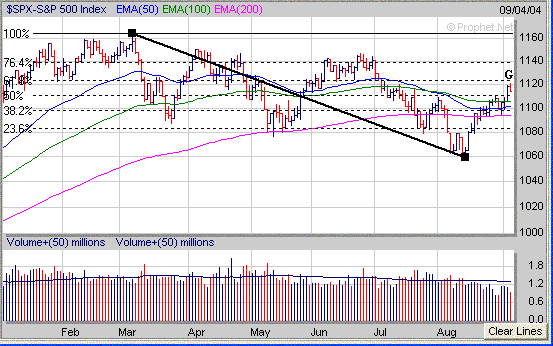
For those watching the price of
Crude Oil there was a bounce this week from oversold conditions as Crude Oil
held support at its 100 Day EMA (blue line) near $41. The two levels I
will be watching over the next few weeks are at $45 and $41. If Crude Oil
breaks above $45 then it could rise back to its mid August high near $50.
However if Crude Oil breaks below $41 then look for a drop back to its 200 Day
EMA (red line) near $38.25. 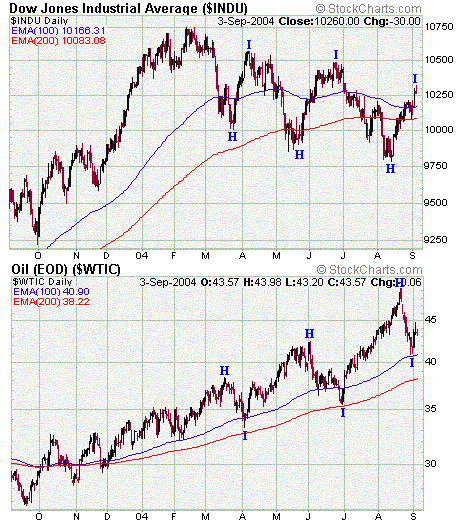
Another thing to notice is that the
Dow and the price of Crude Oil have been generally moving in opposite directions
of each other over the past several months. Notice when the price of Crude
Oil has made a substantial drop (points H to I) the Dow has rallied and when the
price of Crude Oil has rallied (points I to H) the Dow has dropped. It
will be interesting to see if this inverse relationship continues in the months
ahead. Meanwhile when looking for stocks to invest in concentrate
on those which are developing a favorable chart pattern such as the "Cup
and Handle". A stock from our current Stocks to Watch List which has
developed a "Cup and Handle" pattern is TWP. TWP formed a 2 year
Cup and has developed a Handle (H) during the past 5 weeks. Meanwhile the
proper time to buy TWP would be when it breaks above the top of its Handle which
is currently around $45. 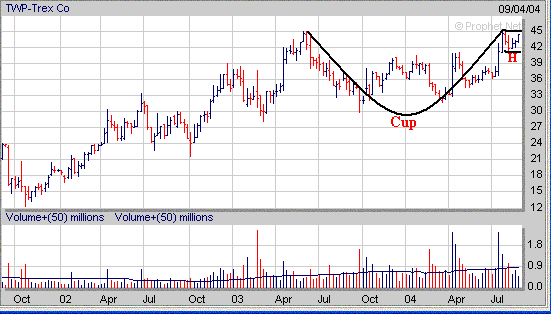
Signup today for a 2
Week Trial Membership and have access to our Market
Timing Indicator (MTI) and our Stocks
to Watch List which provides a list of Stocks that are exhibiting
favorable Chart Patterns along with specific Buy and Stop Loss Prices
in addition to Target Prices. For those that like to short
stocks we also a maintain a small list of potential stocks to short as well.
Also you will receive our Daily Breakout Report
by email which Alerts you to Stocks
that are breaking out of a favorable Chart Pattern from our Stocks
to Watch List.
Click
Here to signup for a "Free" 2 Week Trial Membership
Amateur-Investor.net
|


